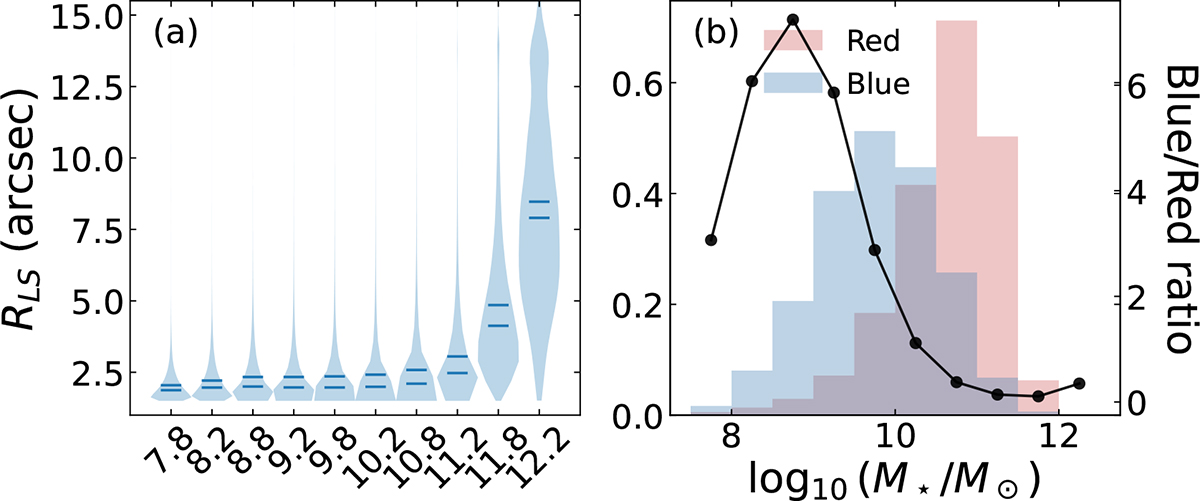
Fig. B.3.
Download original image
Galaxy sizes measured in LS across stellar-mass bins. (a) The distribution of size in arcseconds for each stellar mass bin. The horizontal bars show the 25th and 75th percentiles of the size distribution. (b) The histogram in the bottom panel shows the stellar mass distribution for red and blue galaxies. The black lines show the ratio between blue and red galaxies in each mass bin.
Current usage metrics show cumulative count of Article Views (full-text article views including HTML views, PDF and ePub downloads, according to the available data) and Abstracts Views on Vision4Press platform.
Data correspond to usage on the plateform after 2015. The current usage metrics is available 48-96 hours after online publication and is updated daily on week days.
Initial download of the metrics may take a while.