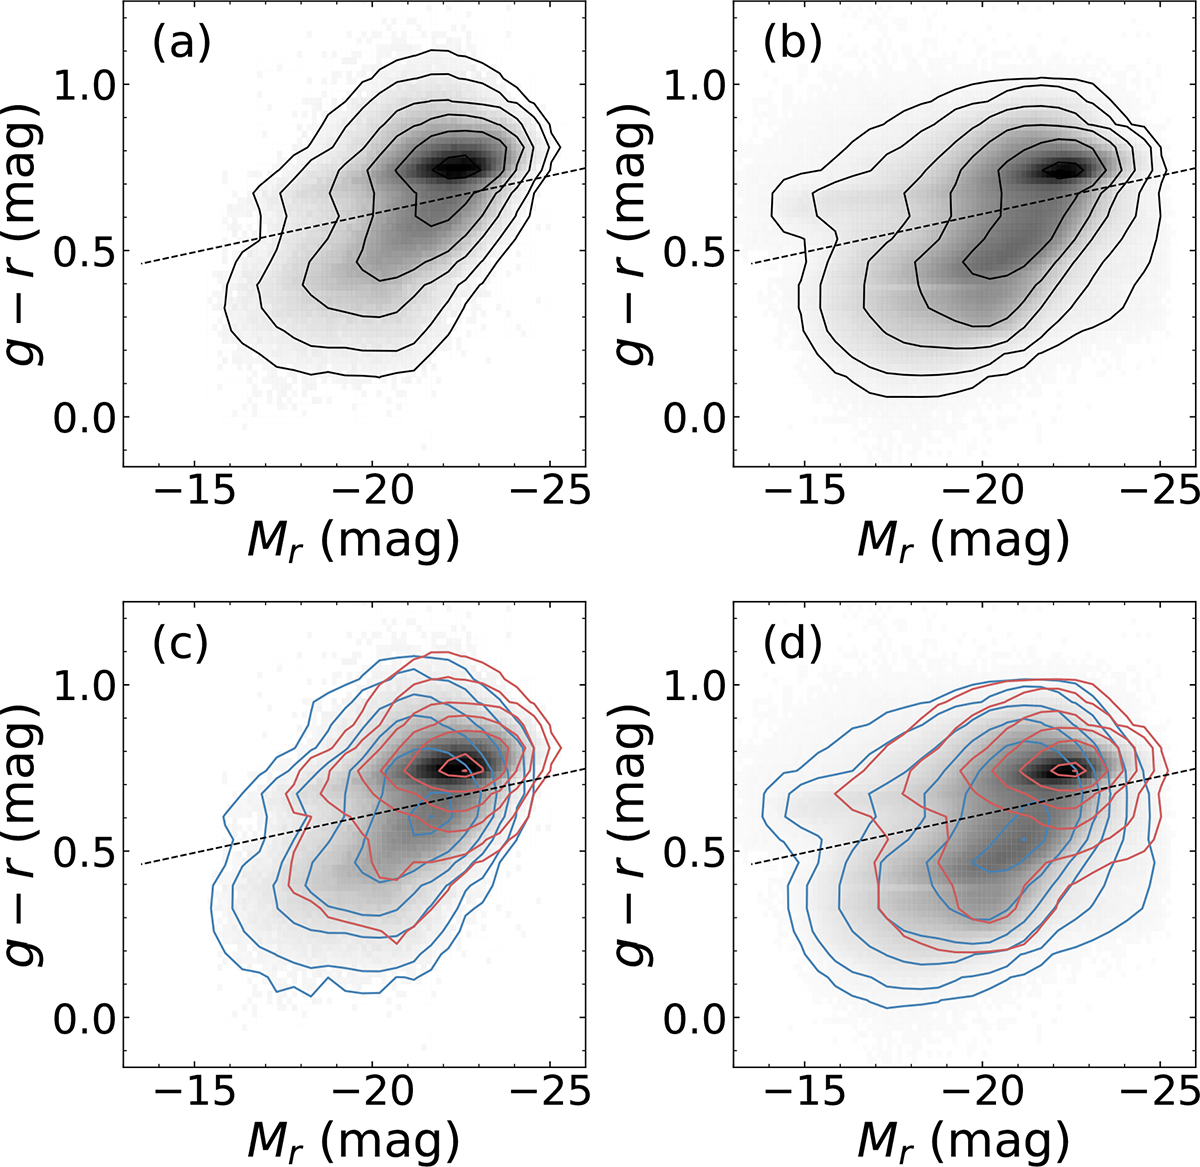
Fig. 2.
Download original image
Color-magnitude diagrams. Upper row: Color-magnitude diagrams of the sz sample (panel a) and the pz sample (panel b). Lower row: Contours show the distribution of galaxies with n > 2.5 (red) and n < 2.5 (blue) for the sz sample (panel c) and the pz sample (panel d). All the contours are drawn at [0.1, 0.5, 3, 10, 30, 80, 99]% of the peak density. The dashed line indicates a fiducial separation between red sequence and blue cloud galaxies, g − r = −0.023 × Mr + 0.15, determined by the eye. Although most galaxies with high Sérsic index are located in the red sequence, the two definitions of the type clearly select different samples of galaxies.
Current usage metrics show cumulative count of Article Views (full-text article views including HTML views, PDF and ePub downloads, according to the available data) and Abstracts Views on Vision4Press platform.
Data correspond to usage on the plateform after 2015. The current usage metrics is available 48-96 hours after online publication and is updated daily on week days.
Initial download of the metrics may take a while.