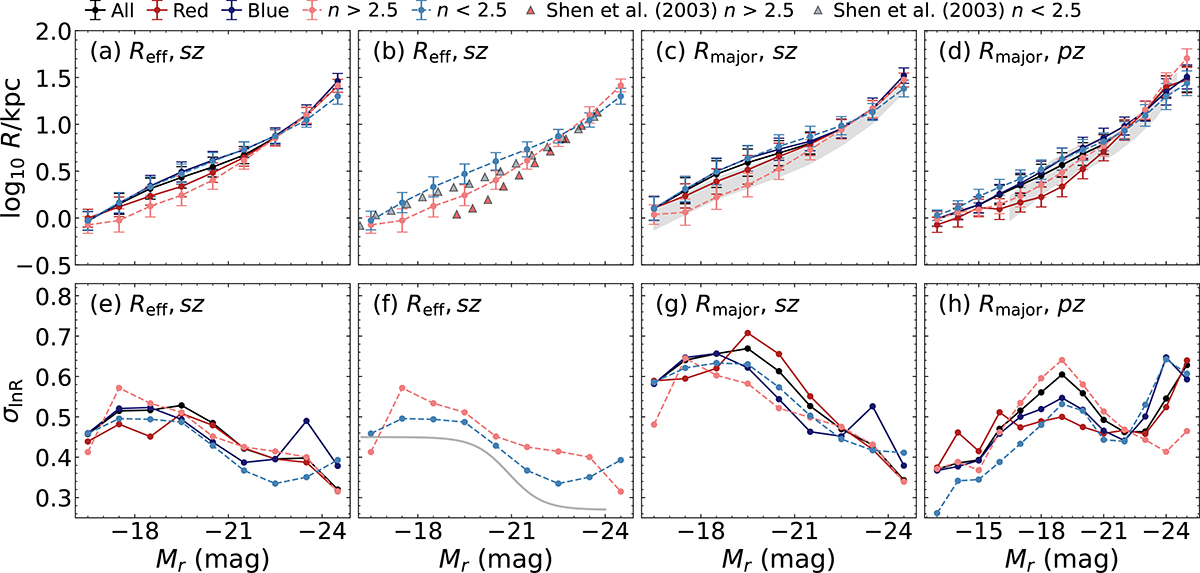
Fig. 4.
Download original image
Magnitude–size relations for our samples. From left to right, panels show (a) the Mr vs. circular effective radius Reff for our sz sample; (b) a comparison of the results in panel a to those of Shen et al. (2003; c) the Mr vs. semi-major axis radius, Rmaj, for our sz sample; and (d) Mr vs. Rmaj for our pz sample. The black circles show results for all the galaxies in a particular sample. Dark red and blue circles show results for the color-selected red and blue subsamples, respectively. Pink and light blue circles show results for the high and low Sérsic index subsamples, respectively. The error bars represent the dispersion of the maximum likelihood fits. In panel b, the red and gray triangles are data points from Shen et al. (2003). For ease of comparison, the shaded gray region in (c) reproduces the Reff relation for the sz sample from panel a. The shaded gray region in panel d reproduces the result for all the galaxies in the sz sample using Rmaj from panel c. We ensured that each Mr bin contains at least 100 galaxies. The bottom panels e–h show how the corresponding dispersion around each relation varies with Mr. In panel f, the dispersion found by Shen et al. (2003) is shown with a thin gray line.
Current usage metrics show cumulative count of Article Views (full-text article views including HTML views, PDF and ePub downloads, according to the available data) and Abstracts Views on Vision4Press platform.
Data correspond to usage on the plateform after 2015. The current usage metrics is available 48-96 hours after online publication and is updated daily on week days.
Initial download of the metrics may take a while.