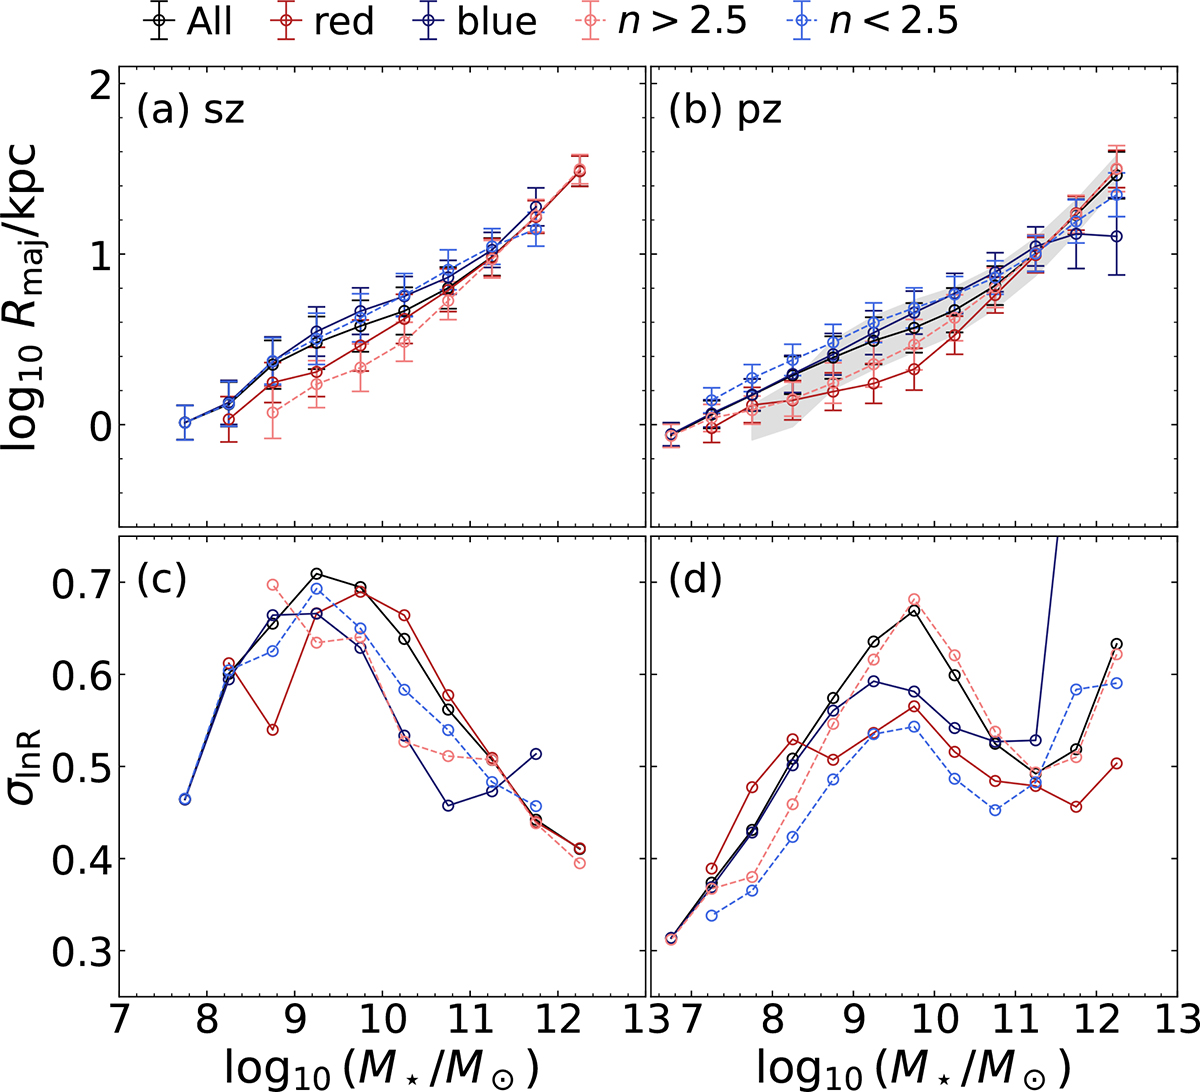
Fig. 5.
Download original image
Size-mass relation for the (a) sz and (b) pz samples. Masses for sz galaxies are from the GSWLC catalog (Salim et al. 2016). Masses for pz galaxies are from WH2024. The line styles and symbols have the same meaning as those in Fig. 4. The error bars represent the dispersion, σ, of the log-likelihood. The bottom panels show σ vs. M★ for (c) sz and (d) pz samples. The gray region in panel b reproduces the result for all the galaxies in the sz sample from panel a.
Current usage metrics show cumulative count of Article Views (full-text article views including HTML views, PDF and ePub downloads, according to the available data) and Abstracts Views on Vision4Press platform.
Data correspond to usage on the plateform after 2015. The current usage metrics is available 48-96 hours after online publication and is updated daily on week days.
Initial download of the metrics may take a while.