Fig. 6.
Download original image
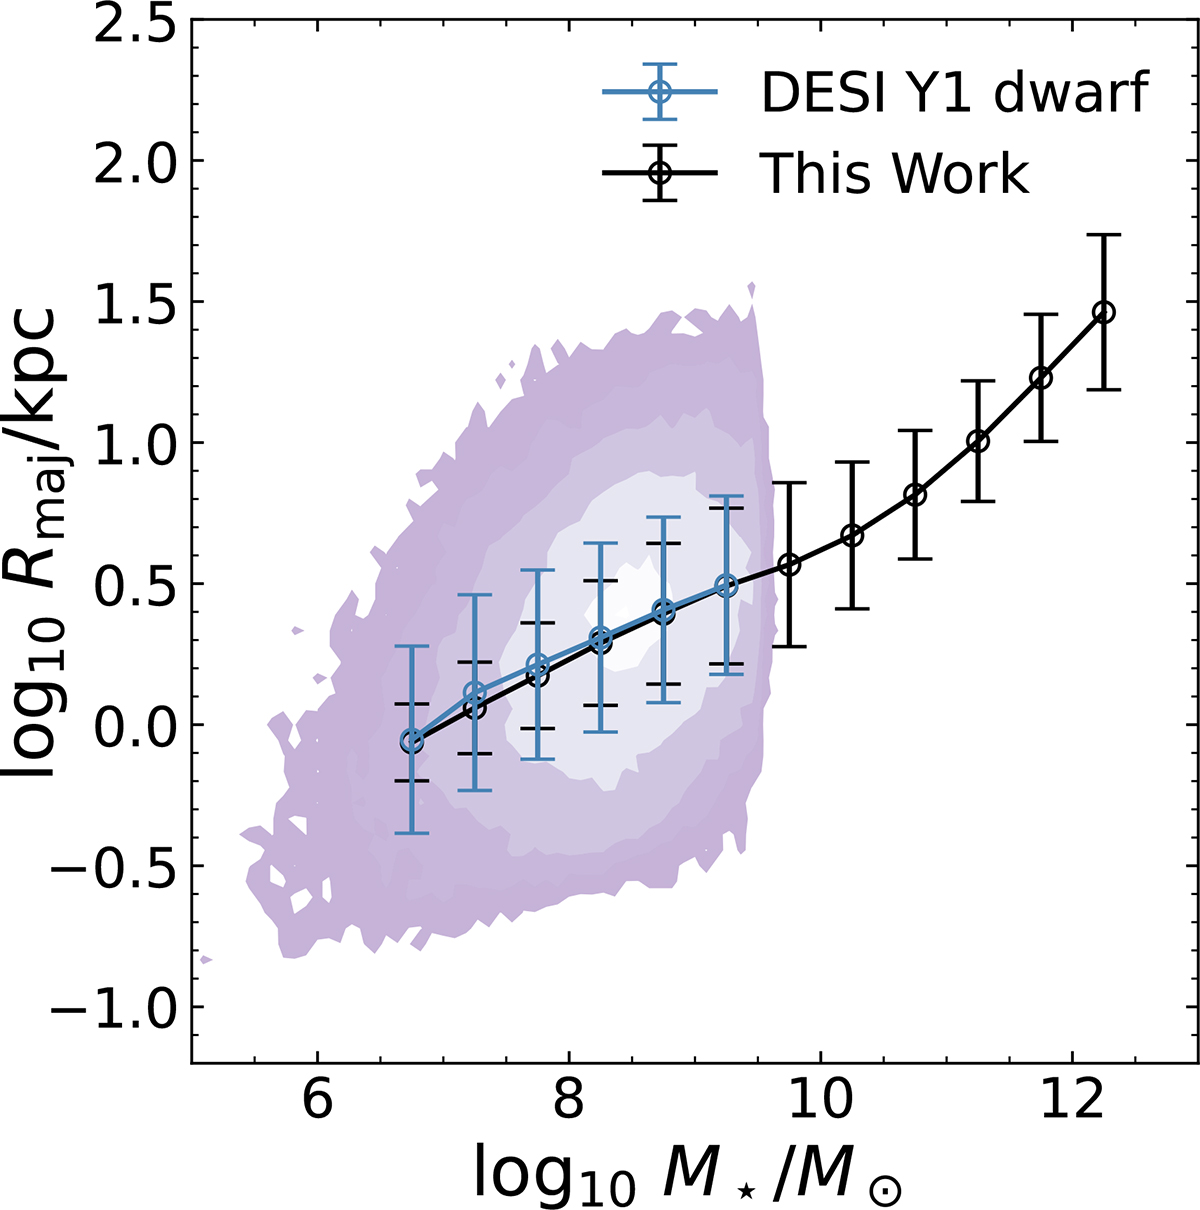
Size-mass relations for our pz sample (black), based on photometric redshifts, and a sample of dwarf galaxies with spectroscopy from the DESI Y1 data release (blue). The error bars show the dispersion (σ) of the maximum likelihood fits to the size distribution at a given mass. The purple contours show the full distribution of the DESI Y1 galaxies.
Current usage metrics show cumulative count of Article Views (full-text article views including HTML views, PDF and ePub downloads, according to the available data) and Abstracts Views on Vision4Press platform.
Data correspond to usage on the plateform after 2015. The current usage metrics is available 48-96 hours after online publication and is updated daily on week days.
Initial download of the metrics may take a while.