Fig. 7.
Download original image
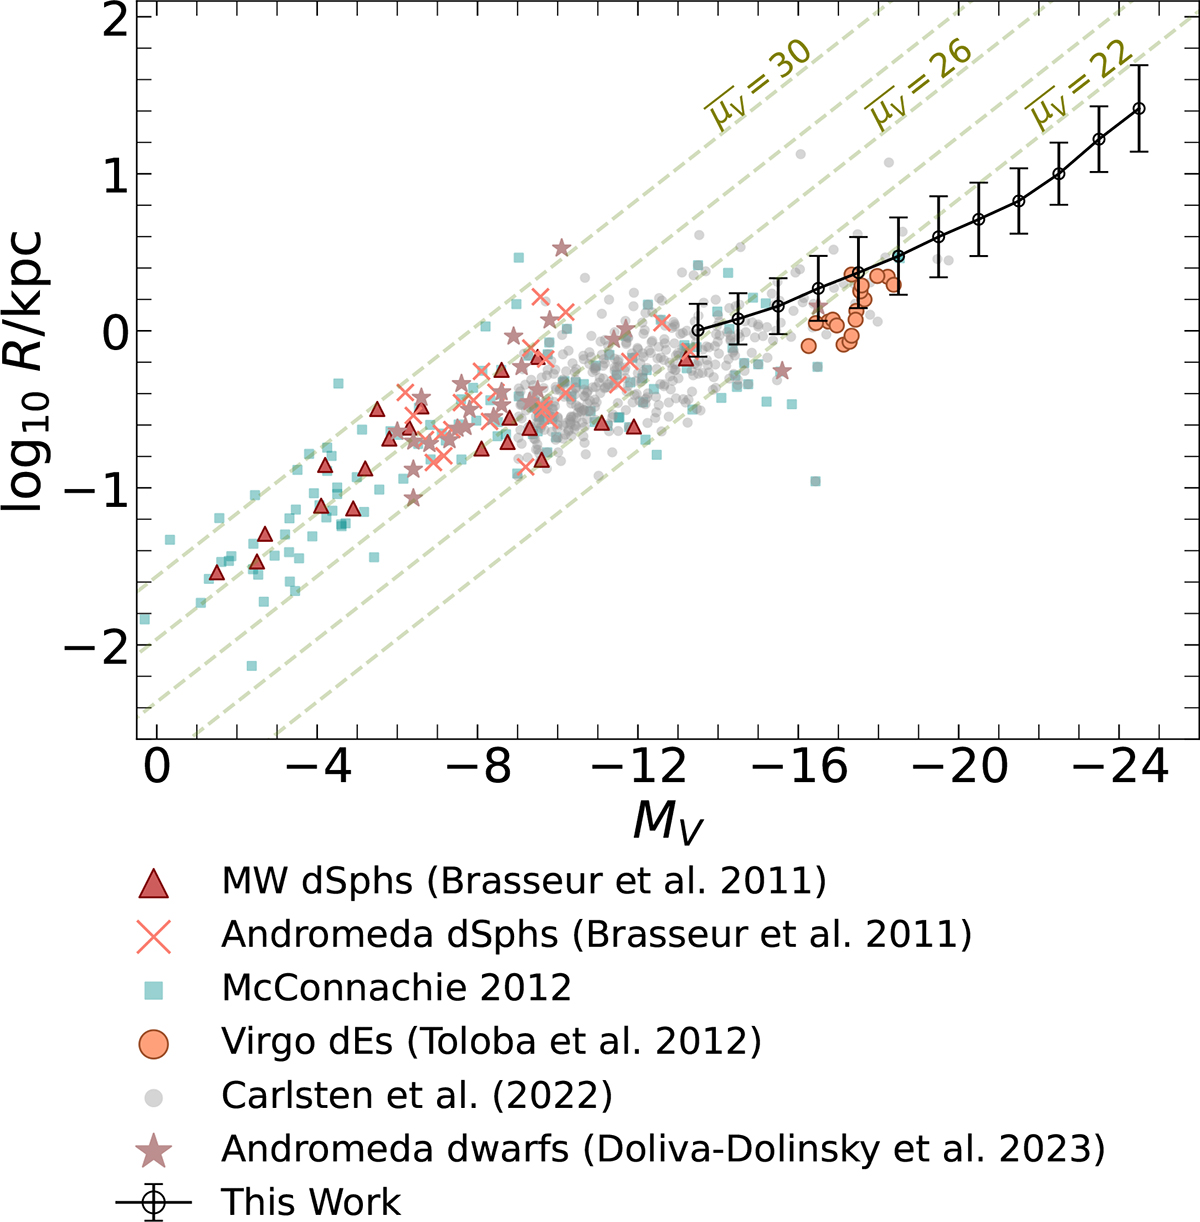
The relation between size and V-band magnitude for our pz sample (black circles, with error bars showing the 10th to 90th percentile range). We compare our size and V-band magnitude relation with the results from the dwarf galaxy literature: Milky Way dSphs (red triangles; Brasseur et al. 2011), Andromeda dSphs (orange crosses; Brasseur et al. 2011), dwarf galaxies in the Local Group (blue squares; McConnachie 2012), Virgo dEs (orange circles; Toloba et al. 2012), satellite dwarf galaxies reported by the ELVES project (gray dots; Carlsten et al. 2022), and Andromeda dwarf galaxies from Doliva-Dolinsky et al. (2023, stars). The dashed green lines show the surface brightness limit in units of magnitudes per square arcsecond.
Current usage metrics show cumulative count of Article Views (full-text article views including HTML views, PDF and ePub downloads, according to the available data) and Abstracts Views on Vision4Press platform.
Data correspond to usage on the plateform after 2015. The current usage metrics is available 48-96 hours after online publication and is updated daily on week days.
Initial download of the metrics may take a while.