Fig. 1.
Download original image
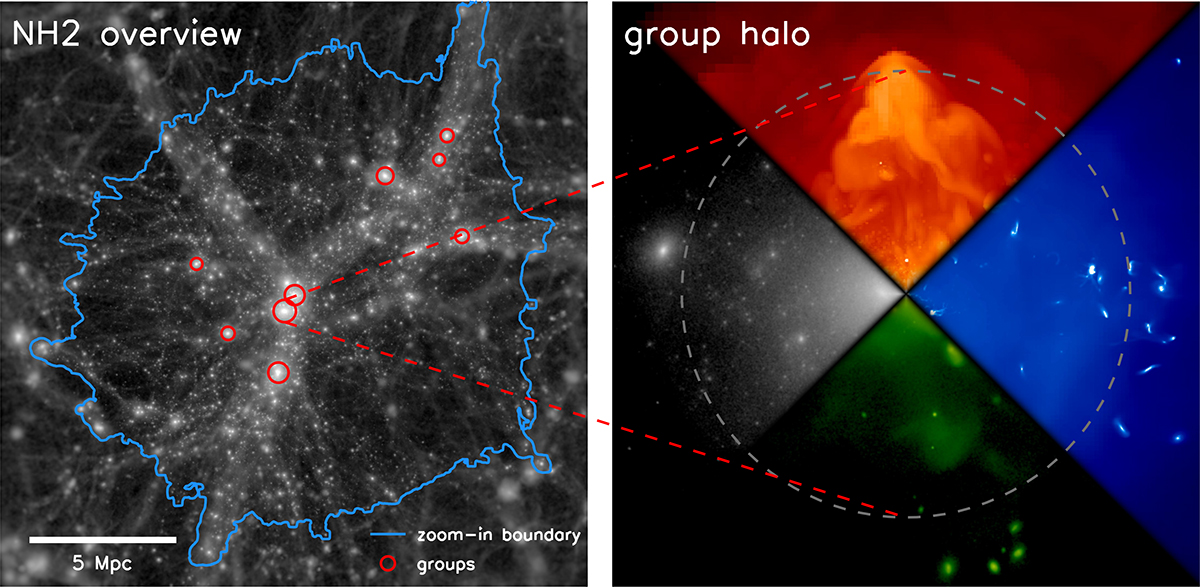
Left panel: Large-scale dark matter density map from the NEWHORIZON2 simulation surrounding the zoomed-in region. The boundary of the zoomed-in region is indicated by the blue solid line. The selected group halos (Mvir > 1012 M⊙) are marked with the red circles. Right panel: Enlarged view of one of the group halos. The different components of the group halo are shown: dark matter in white, gas temperature in red, gas density in blue, and stellar density in green. The gray dashed circle indicates the region within the virial radius.
Current usage metrics show cumulative count of Article Views (full-text article views including HTML views, PDF and ePub downloads, according to the available data) and Abstracts Views on Vision4Press platform.
Data correspond to usage on the plateform after 2015. The current usage metrics is available 48-96 hours after online publication and is updated daily on week days.
Initial download of the metrics may take a while.