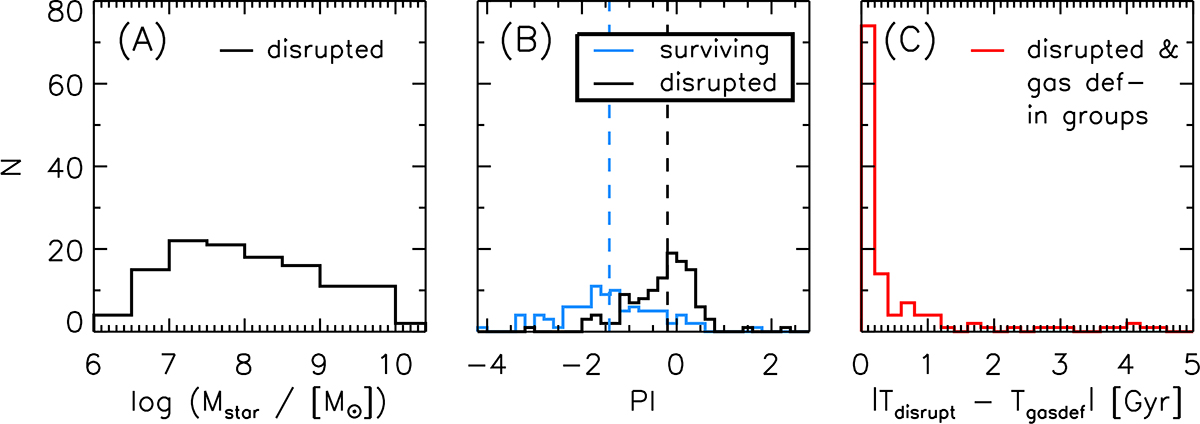
Fig. 10.
Download original image
Panel (A): Stellar mass distribution of disrupted satellite galaxies. The maximum stellar mass of the disrupted galaxies is used in the histogram. Panel (B): Distributions of perturbation index for surviving (blue) and disrupted (black) satellites. The dashed vertical lines indicate the median of each distribution in the corresponding color. The disrupted galaxies show remarkably higher perturbation indices than the surviving ones, suggesting that they are disrupted by interactions with nearby objects within their host groups. Panel (C): Time difference between the epoch of gas loss and the epoch of disruption for each disrupted galaxy. The marginal time difference suggests that the gas loss and gravitational perturbations occurred nearly simultaneously.
Current usage metrics show cumulative count of Article Views (full-text article views including HTML views, PDF and ePub downloads, according to the available data) and Abstracts Views on Vision4Press platform.
Data correspond to usage on the plateform after 2015. The current usage metrics is available 48-96 hours after online publication and is updated daily on week days.
Initial download of the metrics may take a while.