Fig. 11.
Download original image
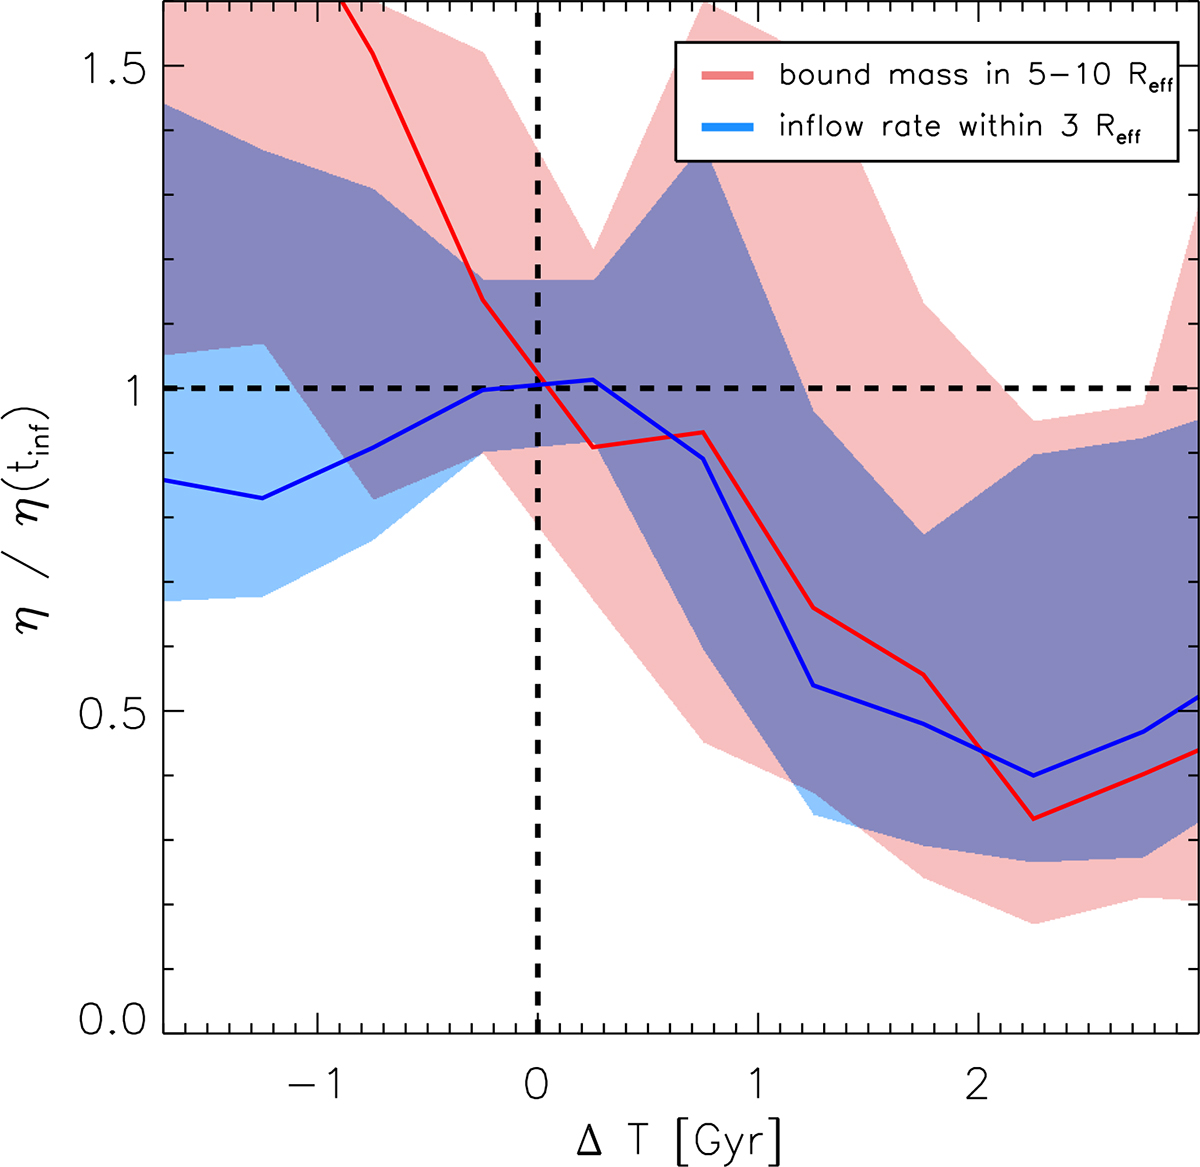
Time evolution of bound gas mass in the outer region (5 − 10 Reff) and the inflow gas rate into the inner region 3 Reff for normal satellites. The evolution of each galaxy is time-aligned such that infall occurs at ΔT = 0. All quantities are normalized to their respective values at the time of infall. The red and blue solid lines show the median evolution of bound mass and gas inflow rate of the galaxies, respectively, while the shaded regions represent the interquartile ranges. Both quantities decrease after infall, reaching 30 − 40% of their initial values at infall, indicating substantial gas stripping in the outer gaseous halos of normal satellites.
Current usage metrics show cumulative count of Article Views (full-text article views including HTML views, PDF and ePub downloads, according to the available data) and Abstracts Views on Vision4Press platform.
Data correspond to usage on the plateform after 2015. The current usage metrics is available 48-96 hours after online publication and is updated daily on week days.
Initial download of the metrics may take a while.