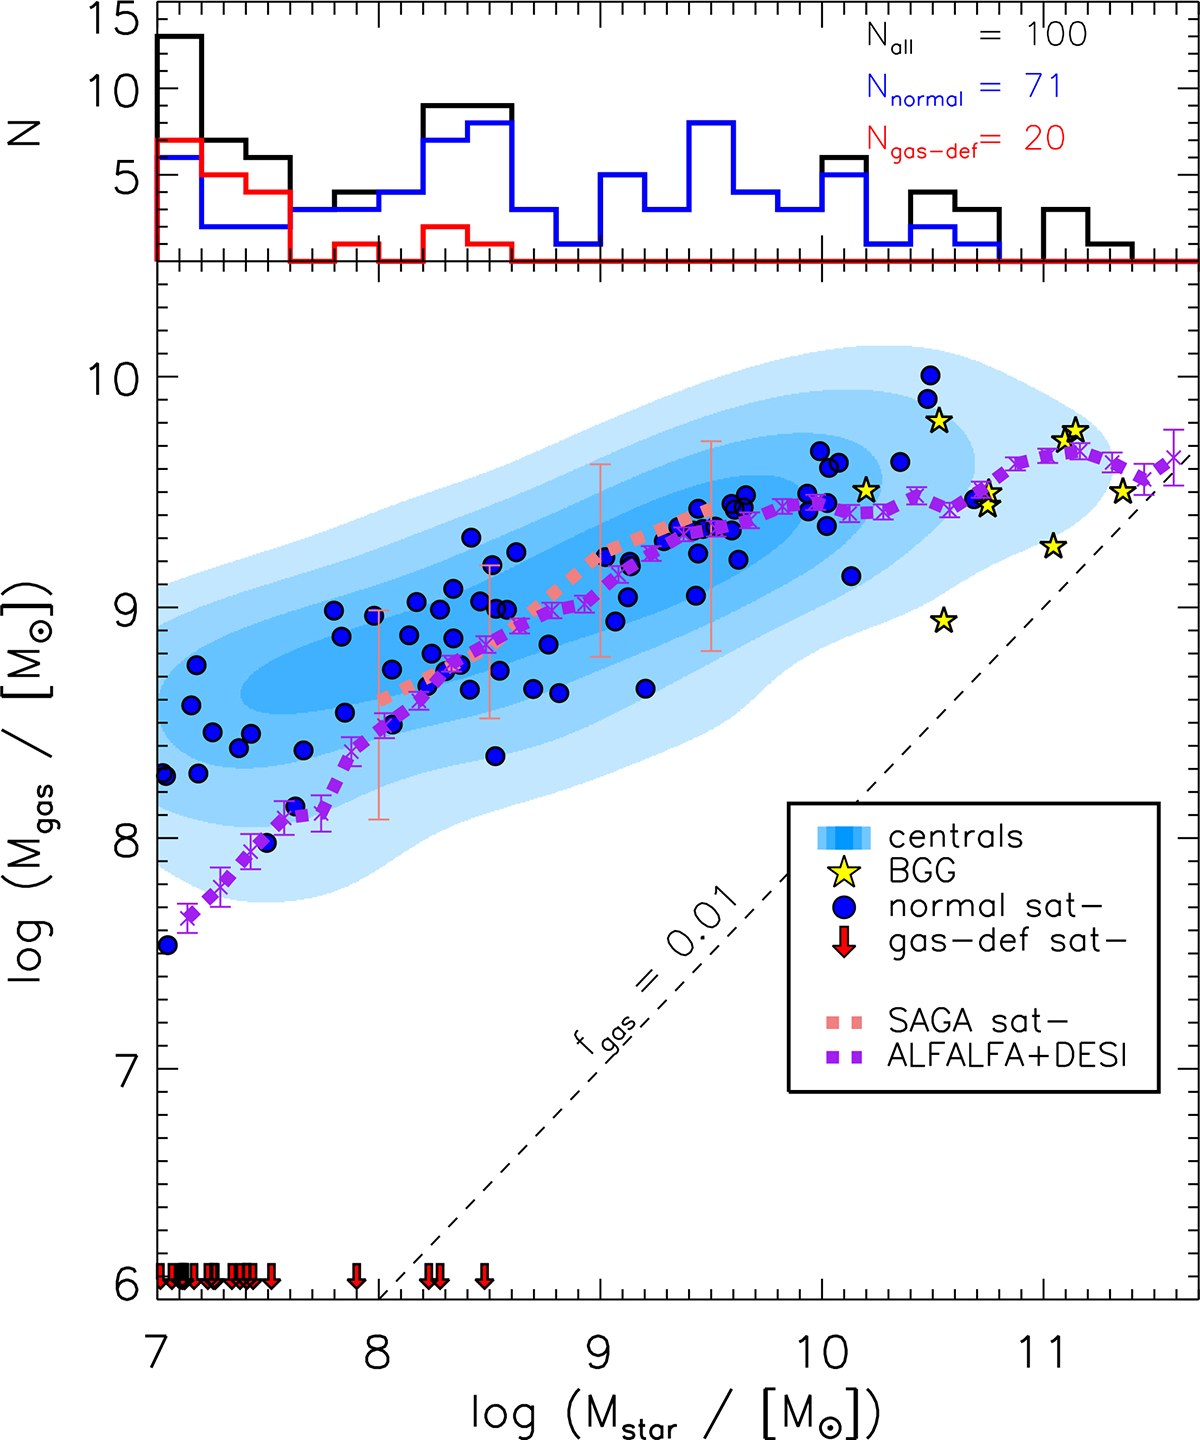
Fig. 2.
Download original image
Stellar mass–gas mass scaling relation for satellite galaxies at the final snapshot (z = 0.158) in the NEWHORIZON2 simulation. Satellite galaxies are categorized as either normal (fgas > 0.01; blue circles) or gas deficient (fgas < 0.01; downward red arrows). For comparison, the scaling relation of the NEWHORIZON2 central galaxies is shown as the blue contours. Gas-rich normal satellite galaxies closely follow the scaling relation of the central galaxies, while gas-deficient satellites are predominantly low-mass systems. The stellar mass distribution of the satellite sample is shown as a histogram at the top. The observed scaling relations from galaxies in the local Universe (purple dotted line) and in low-mass groups (pink dotted line) are overplotted, both showing similar trends to those of the NEWHORIZON2 central galaxies.
Current usage metrics show cumulative count of Article Views (full-text article views including HTML views, PDF and ePub downloads, according to the available data) and Abstracts Views on Vision4Press platform.
Data correspond to usage on the plateform after 2015. The current usage metrics is available 48-96 hours after online publication and is updated daily on week days.
Initial download of the metrics may take a while.