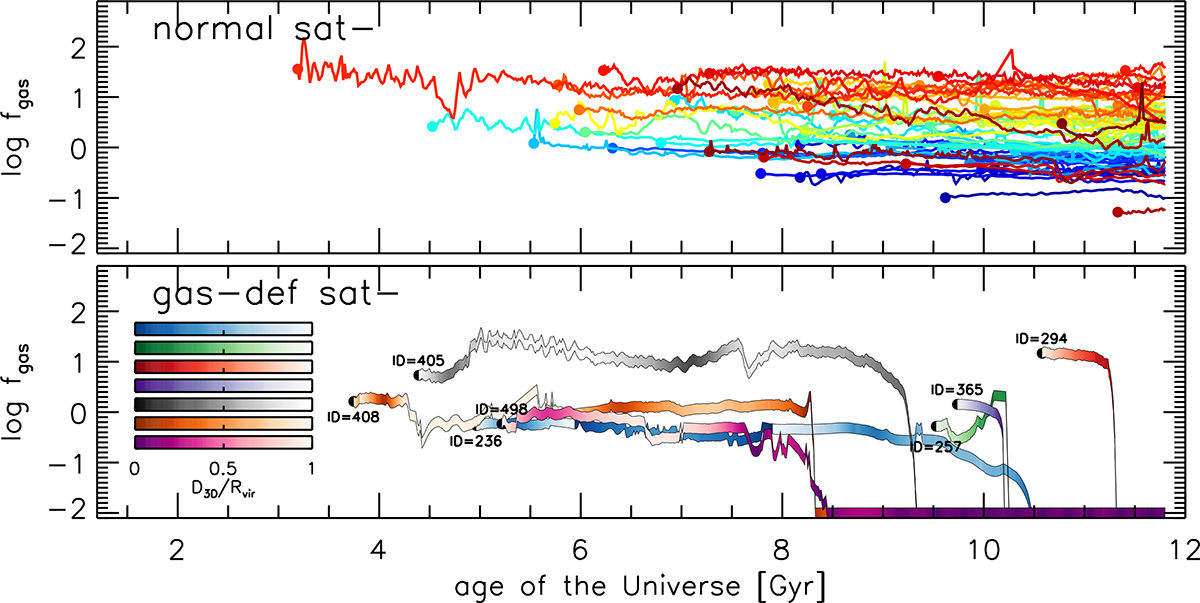
Fig. 3.
Download original image
Evolution of gas fractions for normal (top) and gas-deficient satellite galaxies (bottom) over cosmic time. The colored solid lines in the top panel show the gas fraction of individual normal satellites over cosmic time from their infall to the final snapshot (z = 0.158). In the bottom panel, the gas fraction evolution of the seven gas-deficient galaxies that lost their gas inside the host group is shown. The corresponding galaxy ID for each gas-deficient satellite is also displayed. In each line, the color intensity reflects the distance to the host group center: bolder colors indicate closer proximity (see color bars on the left side). Normal galaxies maintain a relatively constant gas fraction, while gas-deficient satellites experience a rapid loss of gas near the host group center.
Current usage metrics show cumulative count of Article Views (full-text article views including HTML views, PDF and ePub downloads, according to the available data) and Abstracts Views on Vision4Press platform.
Data correspond to usage on the plateform after 2015. The current usage metrics is available 48-96 hours after online publication and is updated daily on week days.
Initial download of the metrics may take a while.