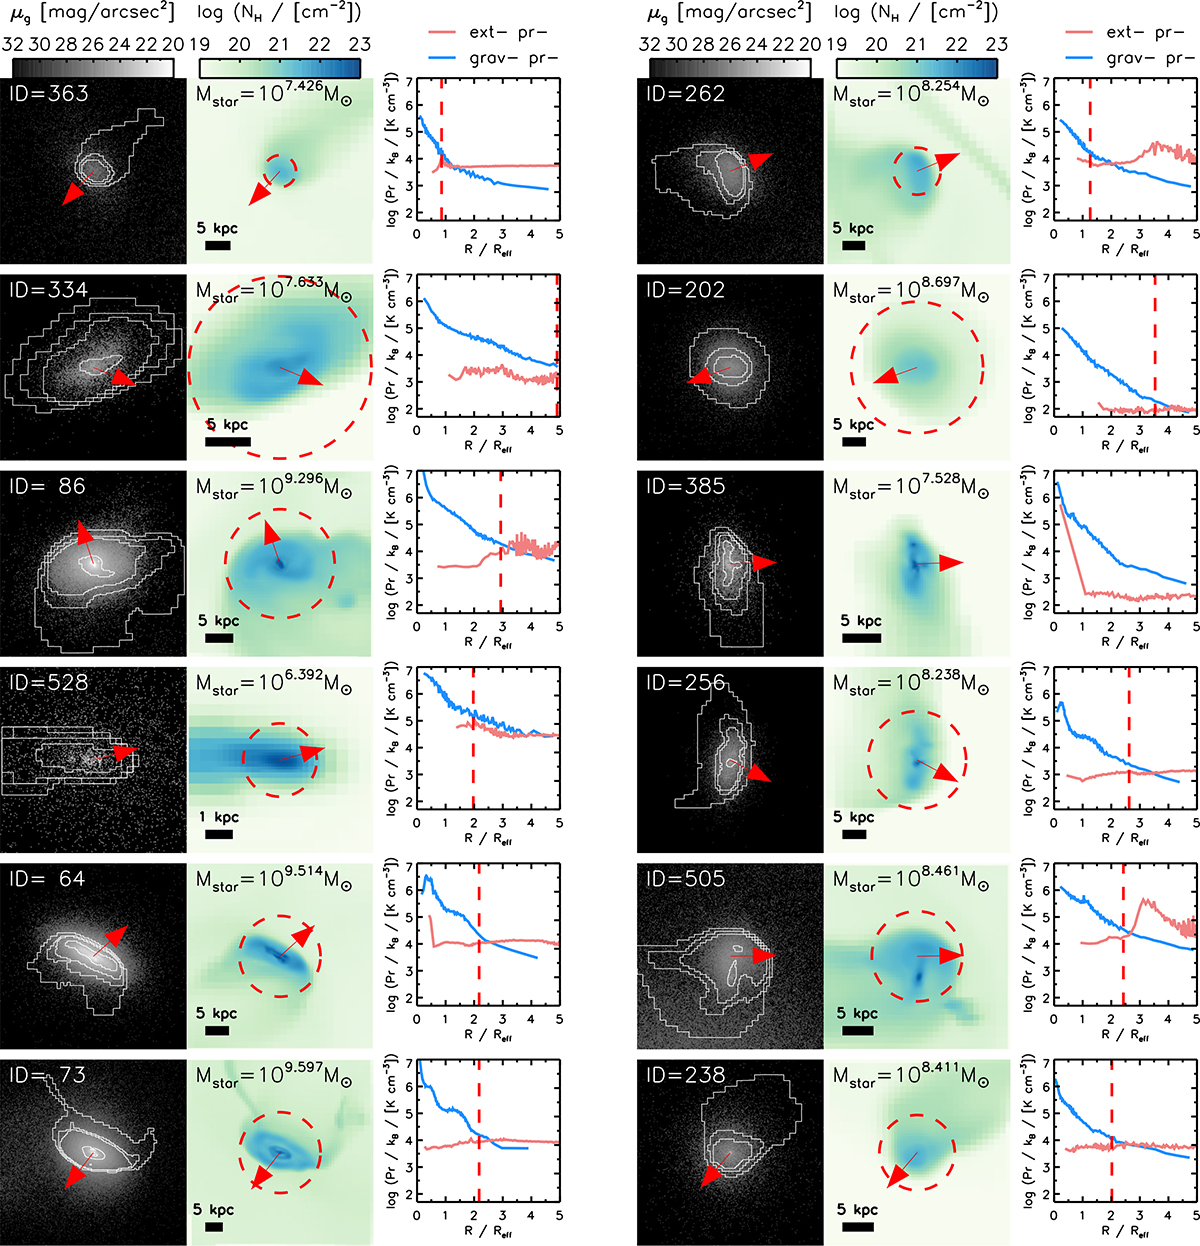
Fig. 4.
Download original image
Stellar and gas morphologies of randomly selected normal satellites at their pericenter passages. Each horizontal triplet corresponds to one galaxy. Left panel: g-band surface brightness of a normal satellite galaxy with gas column density contours. Middle panel: Gas column density map. Right panel: Radial profiles of external pressure (pink solid line) and gravitational pressure (blue solid line), measured in spherical shells centered on the galaxy. In the left and middle panels, the red arrows indicate the direction of the motion of the galaxy. Galaxy ID and stellar mass are given at the top of the images. The stripping radius, defined as the location where Pext = 0.5 Pgrav, is marked by the red dashed vertical line in the pressure profile and by the circle in the gas column density map, if it exists.
Current usage metrics show cumulative count of Article Views (full-text article views including HTML views, PDF and ePub downloads, according to the available data) and Abstracts Views on Vision4Press platform.
Data correspond to usage on the plateform after 2015. The current usage metrics is available 48-96 hours after online publication and is updated daily on week days.
Initial download of the metrics may take a while.