Fig. 5.
Download original image
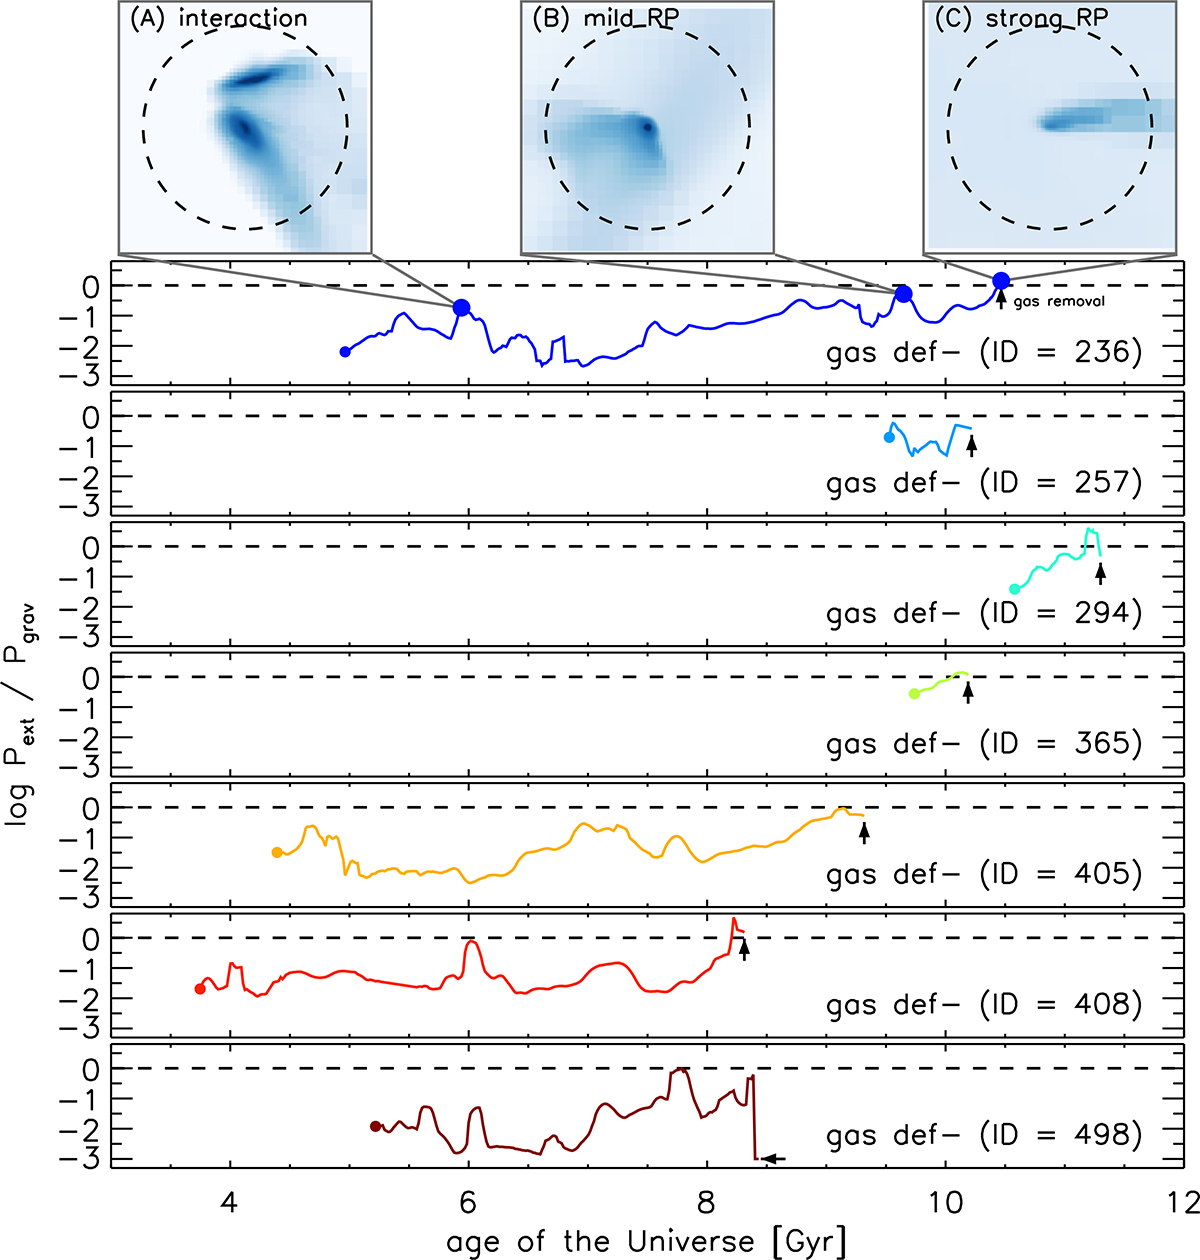
Time evolution of the ratio of external pressure to gravitational pressure for the seven gas-deficient satellites. Both pressures are computed using Equations (1) and (2), and smoothed over a 50 Myr window to reduce fluctuations. The black dashed horizontal lines mark the point at which Pext = Pgrav. The moment of gas removal for each galaxy is marked with the black arrow. For the galaxy with ID = 236, three distinct sources of strong external pressures are illustrated in the top panels through gas column density maps: (A) fly-by interaction with another galaxy, (B) mild ram pressure, and (C) strong ram pressure. In each map, the black dashed circle indicates 2 R90, gas, where R90, gas is the radius enclosing 90% of the ISM gas mass within 3 Reff.
Current usage metrics show cumulative count of Article Views (full-text article views including HTML views, PDF and ePub downloads, according to the available data) and Abstracts Views on Vision4Press platform.
Data correspond to usage on the plateform after 2015. The current usage metrics is available 48-96 hours after online publication and is updated daily on week days.
Initial download of the metrics may take a while.