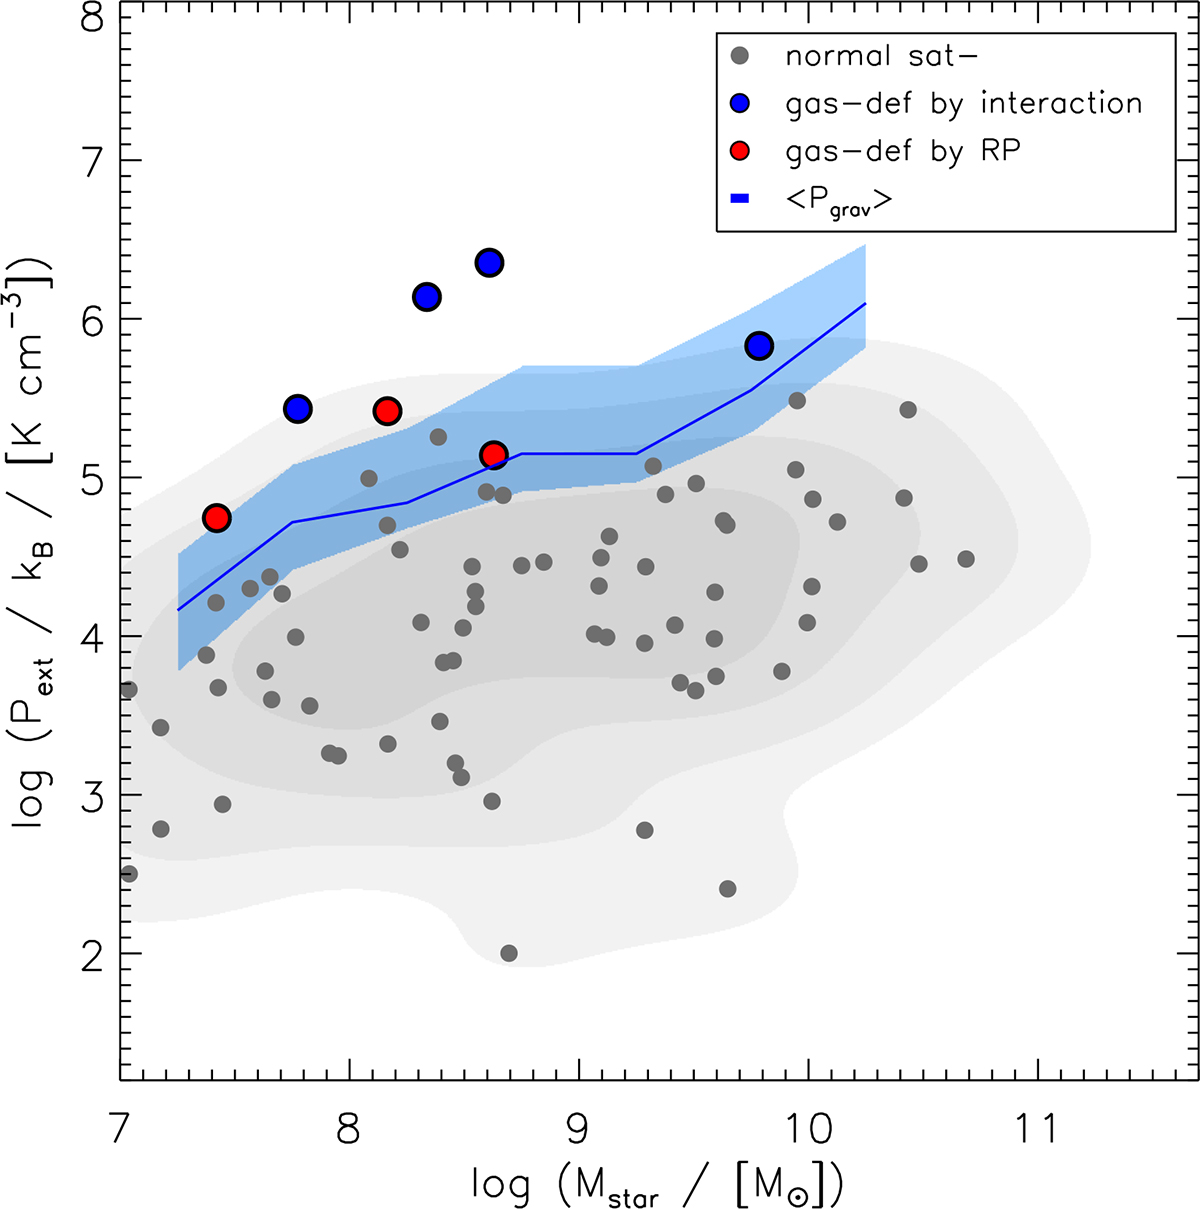
Fig. 7.
Download original image
Maximum external pressure vs. stellar mass for satellite galaxies in the NEWHORIZON2 simulation. Each gray circle represents the maximum external pressure experienced by an individual satellite, while the background contours indicate the overall distribution. The seven gas-deficient galaxies, those stripped by galaxy interactions (blue circles) and by ram pressure (red circles), are highlighted. The blue solid line and shaded region respectively represent the median and quartile ranges of gravitational pressure for satellite galaxies within each stellar mass bin when they are exposed to the maximum external pressure. Gas-deficient satellites experienced external pressure comparable to or exceeding their gravitational pressure, whereas the majority of satellites remain unaffected due to weaker external pressures.
Current usage metrics show cumulative count of Article Views (full-text article views including HTML views, PDF and ePub downloads, according to the available data) and Abstracts Views on Vision4Press platform.
Data correspond to usage on the plateform after 2015. The current usage metrics is available 48-96 hours after online publication and is updated daily on week days.
Initial download of the metrics may take a while.