Fig. 8.
Download original image
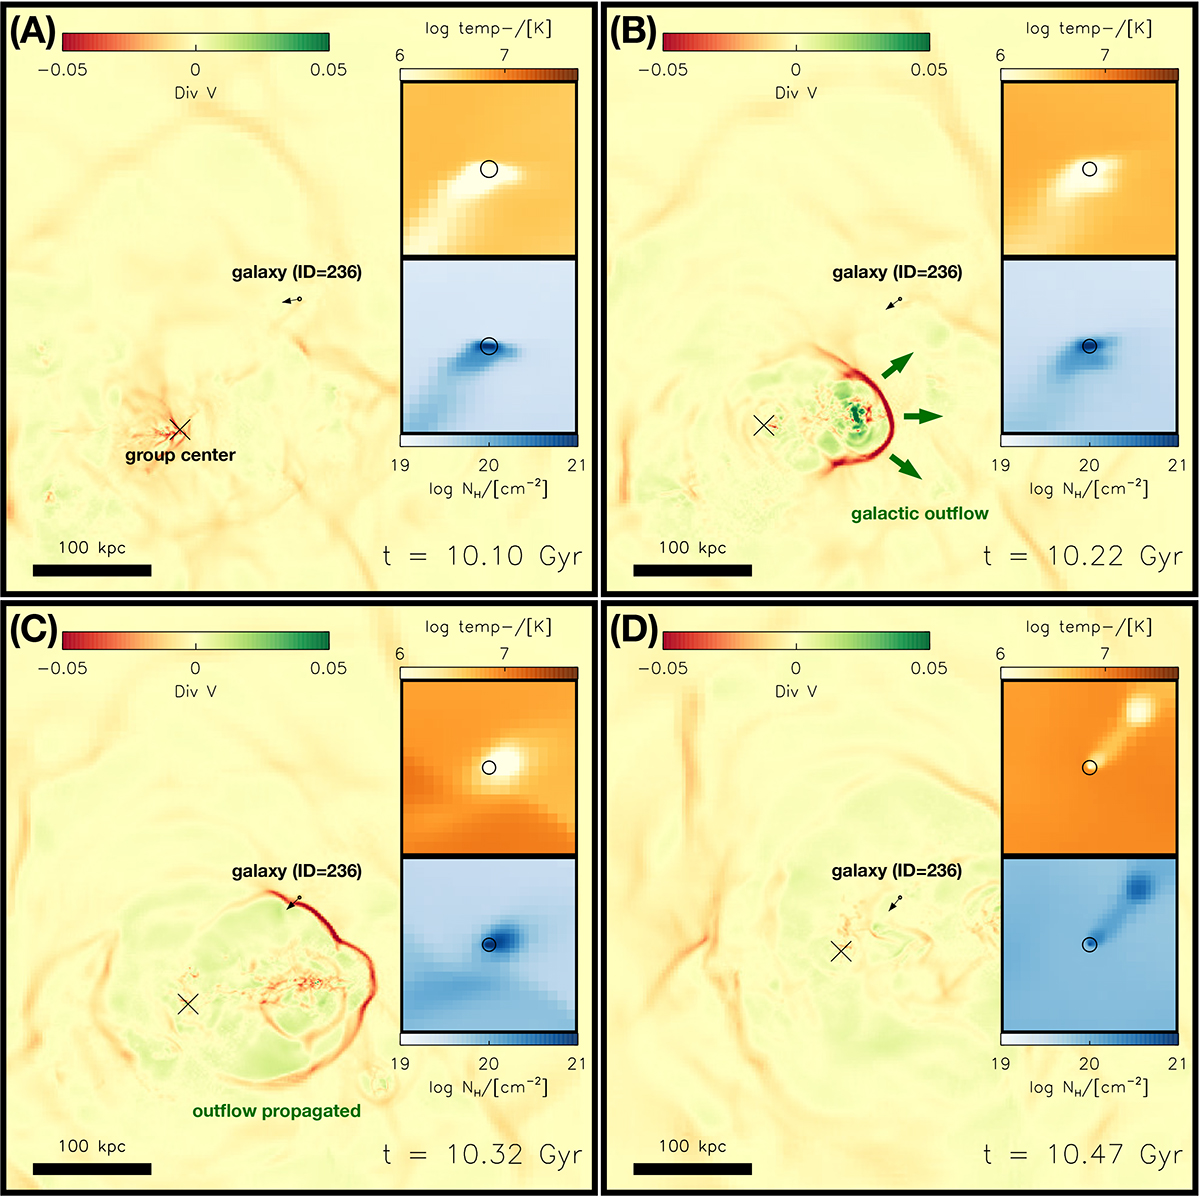
Time sequence of gas stripping in Galaxy ID = 236, shown from Panels (A) to (D). In each panel, the background color map displays the gas velocity divergence, highlighting shock fronts as thin layers of converging flows. The target galaxy is located at the center, and its direction of motion is shown with the black arrow. The host group center is marked by a cross (×). Two images in each panel provide zoomed-in views of the target galaxy, showing gas temperature (top) and column density (bottom). In Panel (B), a shock generated by a galactic outflow from a nearby galaxy begins to propagate toward the target galaxy. In Panel (C), the two insets show the discontinuity in temperature and in density of the surrounding gas along the shock front. The shock interacts with the target galaxy, resulting in strong external pressure on the galaxy.
Current usage metrics show cumulative count of Article Views (full-text article views including HTML views, PDF and ePub downloads, according to the available data) and Abstracts Views on Vision4Press platform.
Data correspond to usage on the plateform after 2015. The current usage metrics is available 48-96 hours after online publication and is updated daily on week days.
Initial download of the metrics may take a while.