Fig. 5
Download original image
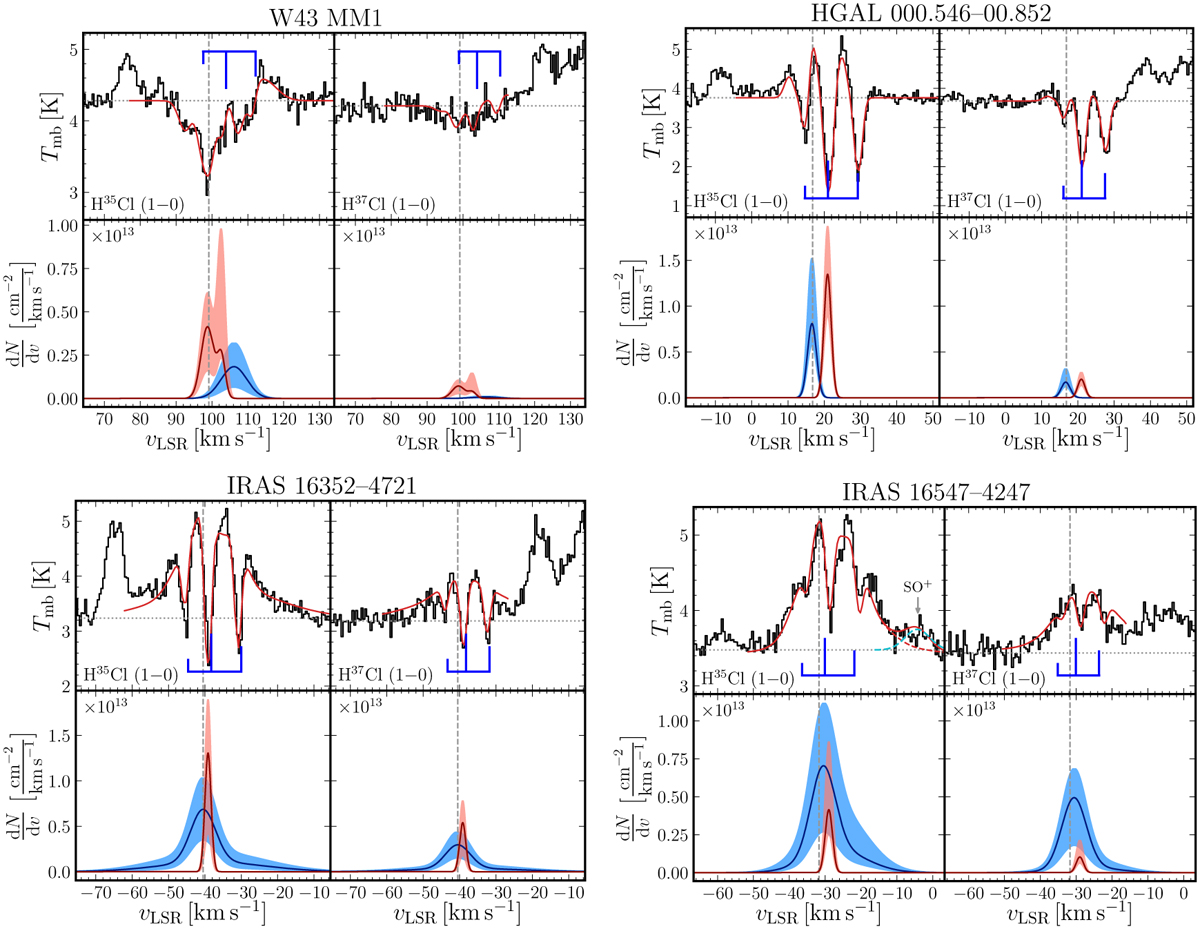
Upper panel: observed line profiles of the H35Cl and H37Cl J = 1–0 line towards W43-MM1, HGAL 000.546−00.852, IRAS 16352−4721, and IRAS 16547−4247, along with their XCLASS fitted models (red curves). The dashed grey lines mark the systemic velocities, while the dotted grey lines mark the fitted continuum temperatures around the presented lines for each source. Bottom panel: the hyperfine structure splitting deconvolved column density profiles. The derived dN/dυ distributions with the corresponding 1σ errors are displayed by the solid blue curve and blue shaded region, respectively. The absorption components are analogously illustrated in red.
Current usage metrics show cumulative count of Article Views (full-text article views including HTML views, PDF and ePub downloads, according to the available data) and Abstracts Views on Vision4Press platform.
Data correspond to usage on the plateform after 2015. The current usage metrics is available 48-96 hours after online publication and is updated daily on week days.
Initial download of the metrics may take a while.