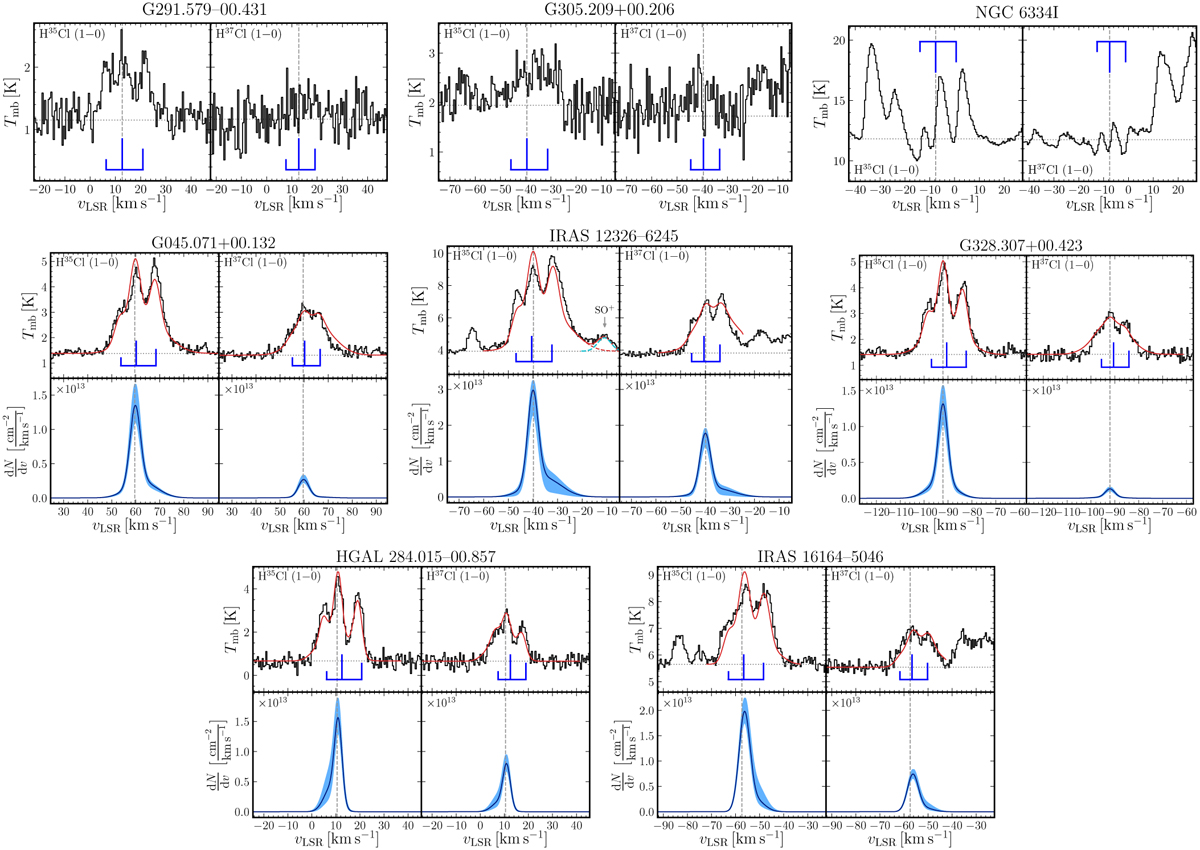
Fig. A.1
Download original image
Observed H35Cl and H37Cl J = 1– 0 line spectra towards the remaining sources displaying only emission features, along with a fit (solid red curve), in the upper panels. The hyperfine structure splitting deconvolved column density profiles are illustrated in the lower panel, where dN/dυ and the 1σ errors for the fitted emission components are displayed by the blue solid curve and blue shaded region. The H35Cl and H37Cl spectra, possessing a strong outflow, are contaminated by SO+ and by CH3CN and CH3OCH3, respectively, towards the red wing. The fits to the SO+ line are shown by the dashed cyan curve. The fit of the contaminating line is overlaid as a dashed cyan curve. The fit to the H35Cl spectrum after subtracting contributions from SO+ is displayed by the dashed red curve. The solid red line represents the combined XCLASS fit to both, H35Cl and SO+. No fit has been performed, if the line temperature of a transition is lower than 3σ for the given RMS, or if no baseline could be estimated (NGC 6334I).
Current usage metrics show cumulative count of Article Views (full-text article views including HTML views, PDF and ePub downloads, according to the available data) and Abstracts Views on Vision4Press platform.
Data correspond to usage on the plateform after 2015. The current usage metrics is available 48-96 hours after online publication and is updated daily on week days.
Initial download of the metrics may take a while.