Fig. 1.
Download original image
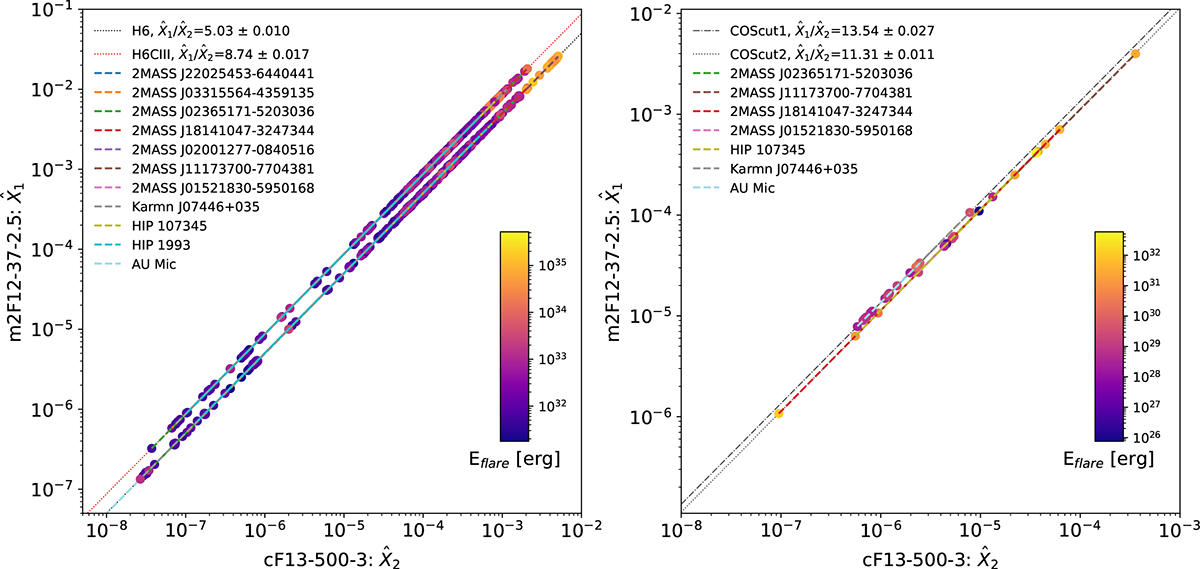
Coefficients of the fitted models for flares in young M dwarfs. The values of ![]() and
and ![]() are plotted on the y- and x-axes, respectively. Each point represents an individual flare event and is colour-coded by the flare energy released in the TESS (left) or the FUV bandpass (right). Model fitting was performed using multiple setups: H6 and H6CIII for the TESS data, and COScut1 and COScut2 for the HST-COS data. Linear regressions fitted to the flare events for each star are shown as dashed coloured lines. To guide the eye, in the panels, the H6, H6CIII, COScut1 and COScut2 ratios are shown as dotted red, dotted black, dash-dotted grey, and dotted grey lines, respectively.
are plotted on the y- and x-axes, respectively. Each point represents an individual flare event and is colour-coded by the flare energy released in the TESS (left) or the FUV bandpass (right). Model fitting was performed using multiple setups: H6 and H6CIII for the TESS data, and COScut1 and COScut2 for the HST-COS data. Linear regressions fitted to the flare events for each star are shown as dashed coloured lines. To guide the eye, in the panels, the H6, H6CIII, COScut1 and COScut2 ratios are shown as dotted red, dotted black, dash-dotted grey, and dotted grey lines, respectively.
Current usage metrics show cumulative count of Article Views (full-text article views including HTML views, PDF and ePub downloads, according to the available data) and Abstracts Views on Vision4Press platform.
Data correspond to usage on the plateform after 2015. The current usage metrics is available 48-96 hours after online publication and is updated daily on week days.
Initial download of the metrics may take a while.