Fig. A.2.
Download original image
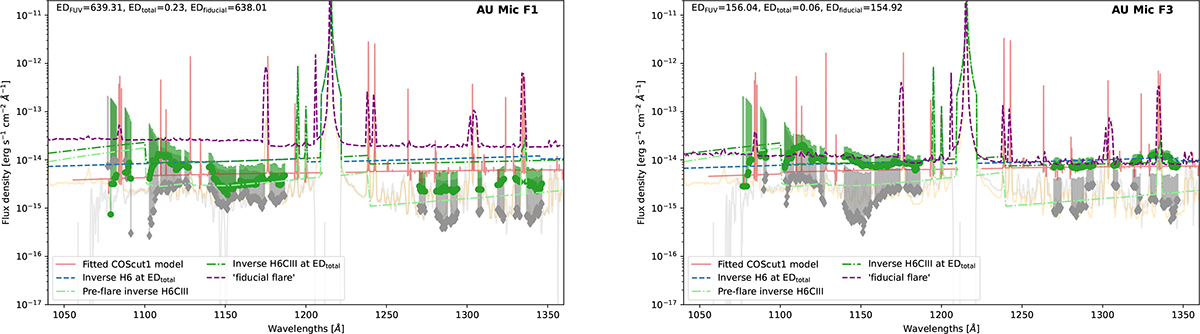
AU Mic spectra at the peak of flares observed with HST-COS. In both panels, green spheres denote continuum flux measurements at the flare peaks, while grey diamonds indicate the quiescent continuum levels. Associated uncertainties are depicted as light-coloured lines – green for the flare peak and grey for quiescence – with only upper error bars shown for clarity, given the symmetry of the errors. The light-red lines represent the best-fit obtained using the COScut1 setup. The dash-dotted green and light-green lines correspond to the H6CIII models with ![]() /
/![]() = 8.74 derived from TESS photometry for the flare peak and pre-flare states, respectively, while the dashed blue lines show the simplified H6 models with
= 8.74 derived from TESS photometry for the flare peak and pre-flare states, respectively, while the dashed blue lines show the simplified H6 models with ![]() /
/![]() = 5.03. The background light-grey spectra are the xdsum products for each respective orbit, representing the summed, extracted 1D spectra from all exposures within an orbit and providing high signal-to-noise reference spectra for comparison. Light-orange lines display smoothed panchromatic AU Mic spectra from Feinstein et al. (2022), and dashed purple lines depict the ‘fiducial flare’ model from Loyd et al. (2018b) at similar equivalent durations, included for context.
= 5.03. The background light-grey spectra are the xdsum products for each respective orbit, representing the summed, extracted 1D spectra from all exposures within an orbit and providing high signal-to-noise reference spectra for comparison. Light-orange lines display smoothed panchromatic AU Mic spectra from Feinstein et al. (2022), and dashed purple lines depict the ‘fiducial flare’ model from Loyd et al. (2018b) at similar equivalent durations, included for context.
Current usage metrics show cumulative count of Article Views (full-text article views including HTML views, PDF and ePub downloads, according to the available data) and Abstracts Views on Vision4Press platform.
Data correspond to usage on the plateform after 2015. The current usage metrics is available 48-96 hours after online publication and is updated daily on week days.
Initial download of the metrics may take a while.