Fig. A.3.
Download original image
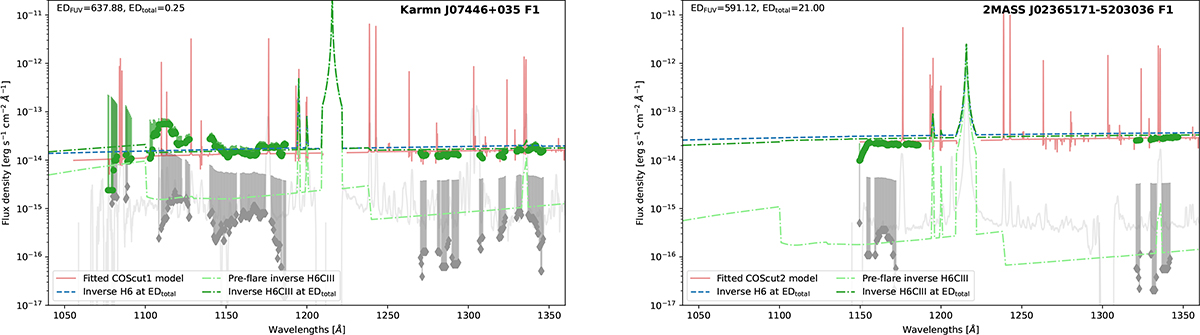
Spectra at the peak of flares observed with HST-COS for Karmn J07446+035 (left) and 2MASS J02365171-5203036 (right). For both stars, green spheres indicate continuum flux measurements at the flare peak, while grey diamonds represent the quiescent continuum levels. Associated uncertainties are shown as light-coloured lines – green for flare peak and grey for quiescence – with only upper error bars displayed for clarity, as the errors are symmetric. The light-red lines correspond to the best-fit continuum models obtained using the COScut1 (left panel) and COScut2 (right panel) setups. The dash-dotted green and light-green lines represent the inverse H6CIII models for the flare peak and pre-flare states, respectively, while the dashed blue lines show the simplified inverse H6 models. The background light-grey spectra are the xdsum spectrum.
Current usage metrics show cumulative count of Article Views (full-text article views including HTML views, PDF and ePub downloads, according to the available data) and Abstracts Views on Vision4Press platform.
Data correspond to usage on the plateform after 2015. The current usage metrics is available 48-96 hours after online publication and is updated daily on week days.
Initial download of the metrics may take a while.