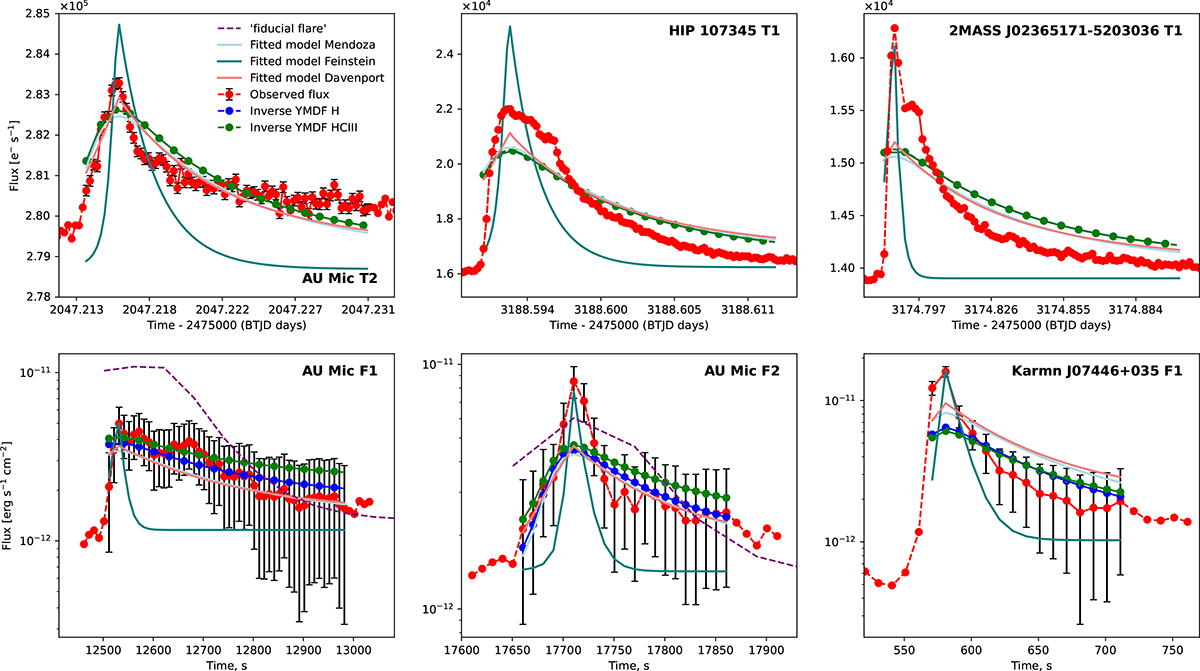
Fig. 2.
Download original image
Light curves of several flares observed in TESS and HST-COS. Upper row: TESS flux light curves (e− s−1) for flares denoted as AU Mic T2, HIP 107345 T1, and 2MASS J02365171-5203036 T1, as dashed lines with red spheres for 20-second observation stamps and black error bars with capped ends. Observation details are provided in Table A.1 in Appendix A.2. Note that errors can be smaller than the sphere size. Three temporal flare model MCMC fitting results are shown: Mendoza (light blue), Davenport (light coral), and Feinstein (teal) models fitted to the observed data. The H6 and H6CIII models, which were inversely calculated using observed EDs for these particular flares, are shown as solid blue and green lines with data-point spheres. In the upper row, the H6 model is hidden by the H6CIII due to overlap as their flux values are very similar. Bottom row: FUV HST-COS flux observations for flares denoted as AU Mic F1, AU Mic F2, and Karmn J07446+035 F1, plotted with consistent styles and model fits, as the upper row. The details of observations for these flares can be found in Table A.2 in Appendix A.4.
Current usage metrics show cumulative count of Article Views (full-text article views including HTML views, PDF and ePub downloads, according to the available data) and Abstracts Views on Vision4Press platform.
Data correspond to usage on the plateform after 2015. The current usage metrics is available 48-96 hours after online publication and is updated daily on week days.
Initial download of the metrics may take a while.