Fig. 3.
Download original image
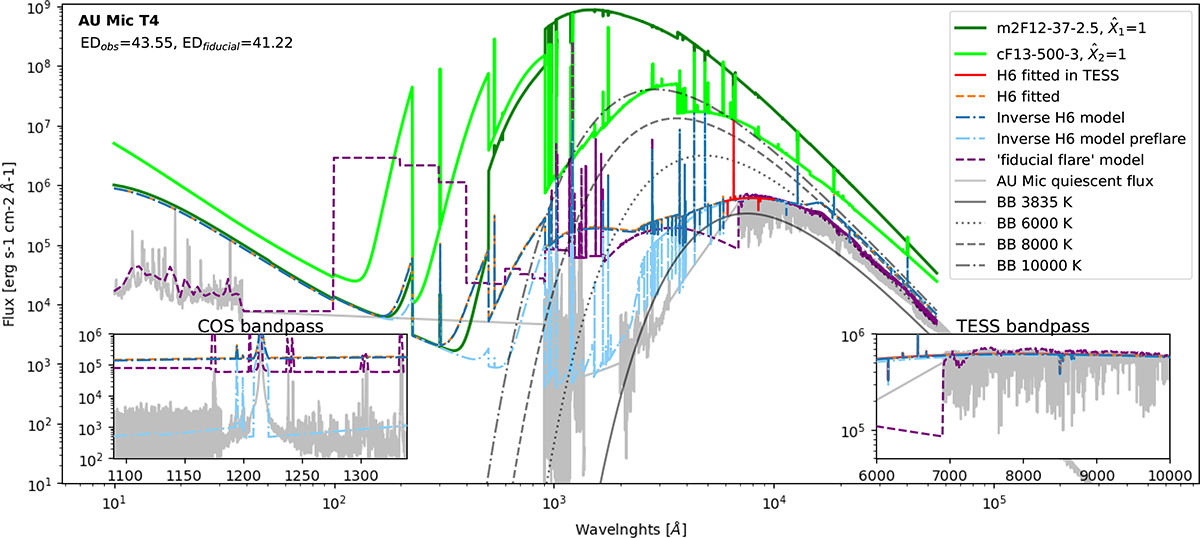
Observed and modelled surface flux density. The m2F12-37-2.5 (dark green) and cF13-500-3 (light green) stellar atmosphere models are plotted at coefficients ![]() and
and ![]() (the theoretical assumption of the entire stellar surface exhibiting flaring activity). For AU Mic during a flare, the solid red and dashed orange lines show the fitted model spectrum at flare maximum using coefficients from the example fit (the flare data are stated in Table A.1 in Appendix A.2). The inverse H6 model at flare maximum, pre-flare, and the ‘fiducial flare’ model from Loyd et al. (2018b) with a comparable ED is plotted as dash-dotted blue, dash-dotted light-blue, and dashed purple lines, respectively. Blackbody curves for 3850 K, 6000 K, 8000 K, and 10 000 K are included in solid, dotted, dashed, and dash-dotted black lines. The panchromatic AU Mic flux from Feinstein et al. (2022) is plotted in light grey. Insets highlight the FUV (lower left) and TESS (lower right) wavelength ranges.
(the theoretical assumption of the entire stellar surface exhibiting flaring activity). For AU Mic during a flare, the solid red and dashed orange lines show the fitted model spectrum at flare maximum using coefficients from the example fit (the flare data are stated in Table A.1 in Appendix A.2). The inverse H6 model at flare maximum, pre-flare, and the ‘fiducial flare’ model from Loyd et al. (2018b) with a comparable ED is plotted as dash-dotted blue, dash-dotted light-blue, and dashed purple lines, respectively. Blackbody curves for 3850 K, 6000 K, 8000 K, and 10 000 K are included in solid, dotted, dashed, and dash-dotted black lines. The panchromatic AU Mic flux from Feinstein et al. (2022) is plotted in light grey. Insets highlight the FUV (lower left) and TESS (lower right) wavelength ranges.
Current usage metrics show cumulative count of Article Views (full-text article views including HTML views, PDF and ePub downloads, according to the available data) and Abstracts Views on Vision4Press platform.
Data correspond to usage on the plateform after 2015. The current usage metrics is available 48-96 hours after online publication and is updated daily on week days.
Initial download of the metrics may take a while.