Fig. 4.
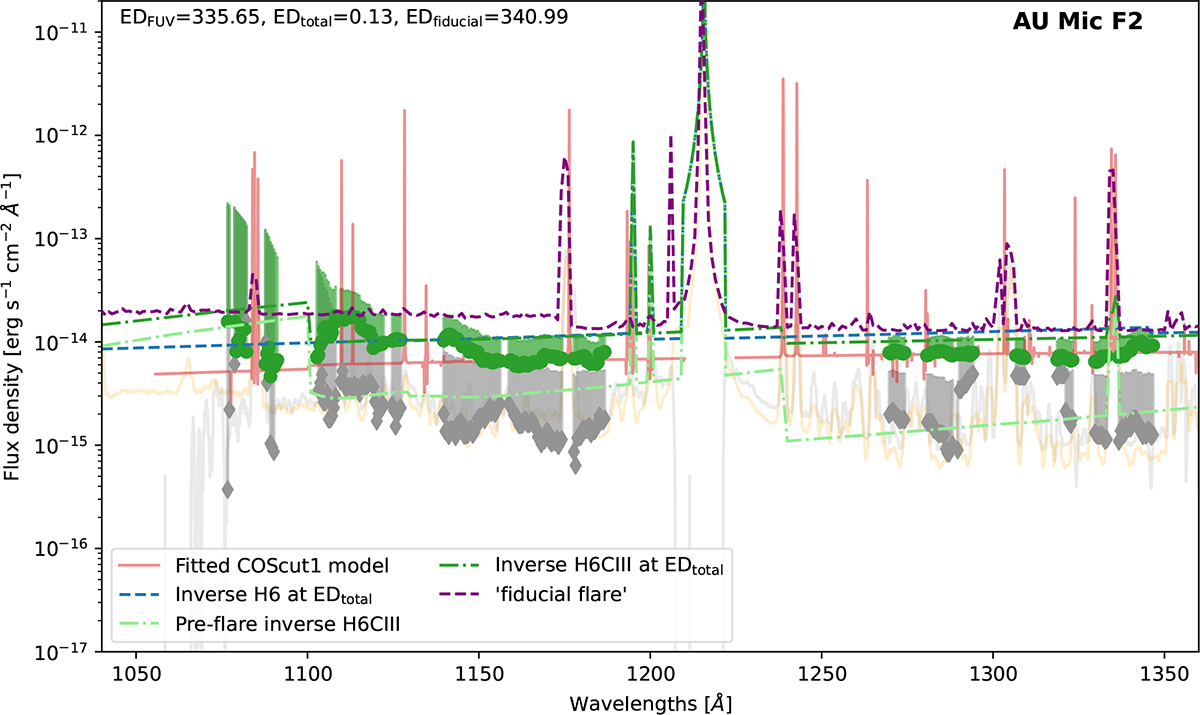
Download original image
Flare spectra in FUV HST-COS. Green circles and grey diamonds indicate the continuum flux at the flare peak and pre-flare, respectively, with uncertainties displayed as corresponding light-coloured lines. Only the upper error bars are shown for visibility, as the errors are symmetric. The best-fit model to the continuum fluxes, derived using the COScut1 spectral setup, is plotted as a light-red line. The dashed blue, dash-dotted green, and dash-dotted light-green lines correspond to the H6 and H6CIII setups at the peak, and pre-flare H6, respectively. The light-grey, light-orange, and dashed purple lines represent the sum of the extracted 1D spectra from all exposures in the orbit, the smoothed panchromatic spectrum of AU Mic from Feinstein et al. (2022), and the ‘fiducial flare’ model from Loyd et al. (2018b) at a similar ED, respectively.
Current usage metrics show cumulative count of Article Views (full-text article views including HTML views, PDF and ePub downloads, according to the available data) and Abstracts Views on Vision4Press platform.
Data correspond to usage on the plateform after 2015. The current usage metrics is available 48-96 hours after online publication and is updated daily on week days.
Initial download of the metrics may take a while.