Fig. 5.
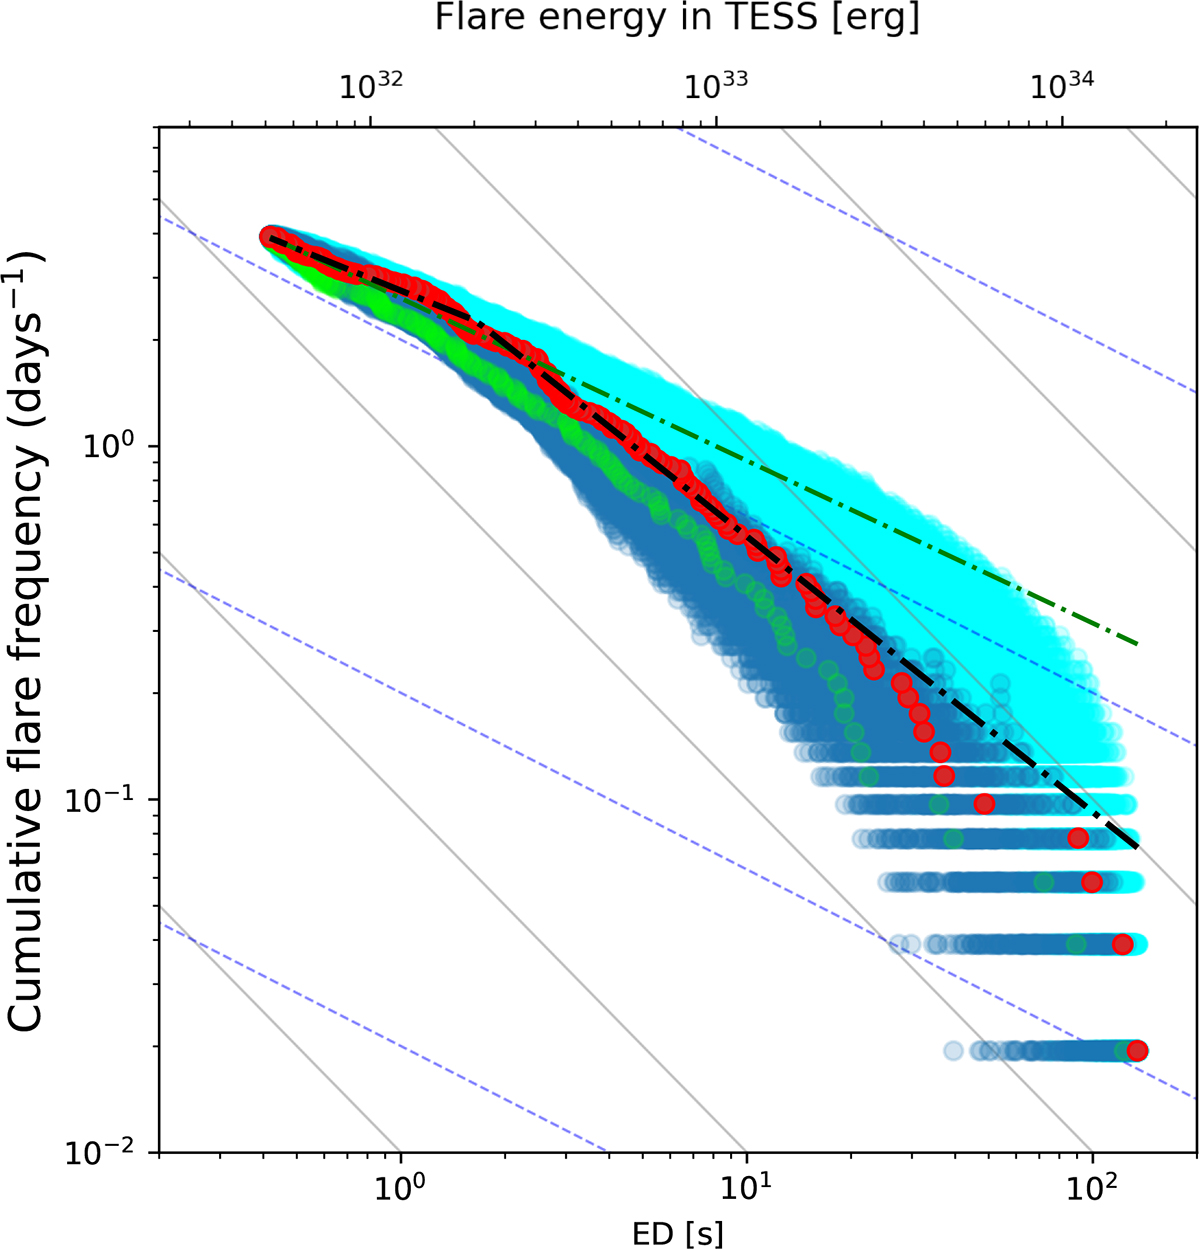
Download original image
Cumulative FFDs (scatter) of simulated ED distributions for broken power-law relation (blue spheres) with α1 = 1.39 and α2 = 1.8 found from the observed distribution of AU Mic white-light flares. The intrinsic observed AU Mic’s FFD is plotted as red spheres (adopted from Paper I, Fig. 5, left panel). Simulated ED distributions for single power laws with α = 1.39 and α = 1.8 are shown as light-blue and lime spheres, respectively. The resulting distributions are from one example run with 1000 random samples, plotted only if the sample meets p > 0.01 in the K–S test. The solid grey and dashed blue guides correspond to power-law coefficients α = 2.0 and α = 1.5, respectively, for a range of β coefficients.
Current usage metrics show cumulative count of Article Views (full-text article views including HTML views, PDF and ePub downloads, according to the available data) and Abstracts Views on Vision4Press platform.
Data correspond to usage on the plateform after 2015. The current usage metrics is available 48-96 hours after online publication and is updated daily on week days.
Initial download of the metrics may take a while.