Fig. 6.
Download original image
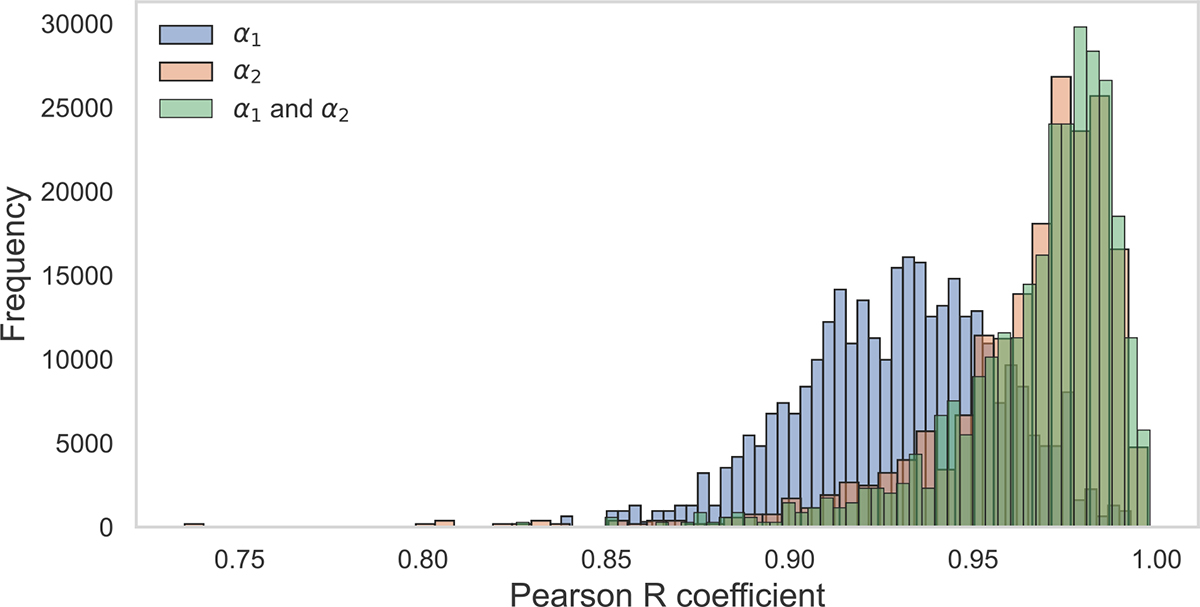
Pearson R coefficients indicating the linear correlation with the intrinsic observed AU Mic ED distribution, shown for simulated ED distributions generated using a broken power law with observed slopes α1 = 1.39 and α2 = 1.8 (green bars), and for single power-law distributions using α1 (blue bars) and α2 (red bars), respectively. Results are based on an example run with 1000 random samples.
Current usage metrics show cumulative count of Article Views (full-text article views including HTML views, PDF and ePub downloads, according to the available data) and Abstracts Views on Vision4Press platform.
Data correspond to usage on the plateform after 2015. The current usage metrics is available 48-96 hours after online publication and is updated daily on week days.
Initial download of the metrics may take a while.