Fig. 7.
Download original image
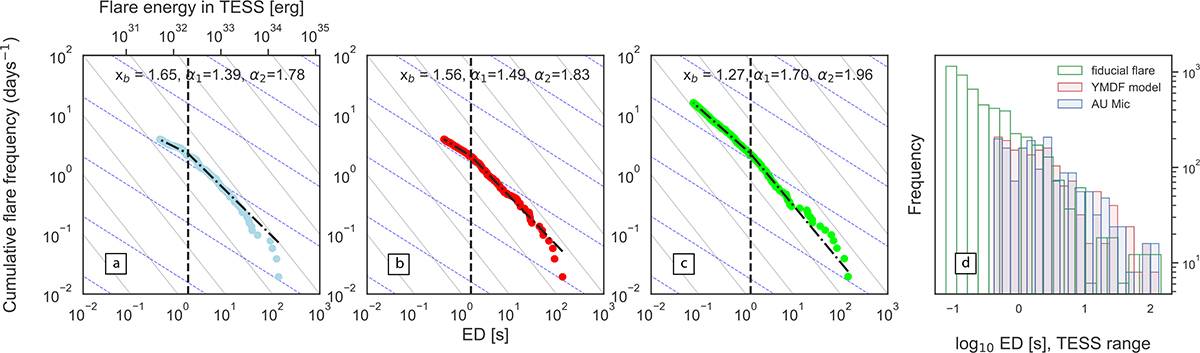
Cumulative FFDs of simulated and observed EDs in the TESS range. Left: Corresponding FFDs in the TESS bandpass, including the observed data (panel ‘a’.), a representative synthetic distribution generated by the YMDF model (panel ‘b’), and a representative synthetic distribution generated by the ‘fiducial flare’ model (panel ‘c’). The synthetic distributions are produced for the period of observations corresponding to the observed periods for AU Mic in TESS (∼51 days). The solid grey and dashed blue guides denote reference power-law slopes of α = 2.0 and α = 1.5, respectively. Panel ‘d’: Synthetic distributions, produced for the period of observations corresponding to the observed periods for AU Mic in TESS. Blue, red, and green bars indicate distributions produced by the ‘fiducial flare’ model, the YMDF model, and the observed ED distributions across two TESS sectors (1 and 27) for Au Mic, respectively.
Current usage metrics show cumulative count of Article Views (full-text article views including HTML views, PDF and ePub downloads, according to the available data) and Abstracts Views on Vision4Press platform.
Data correspond to usage on the plateform after 2015. The current usage metrics is available 48-96 hours after online publication and is updated daily on week days.
Initial download of the metrics may take a while.