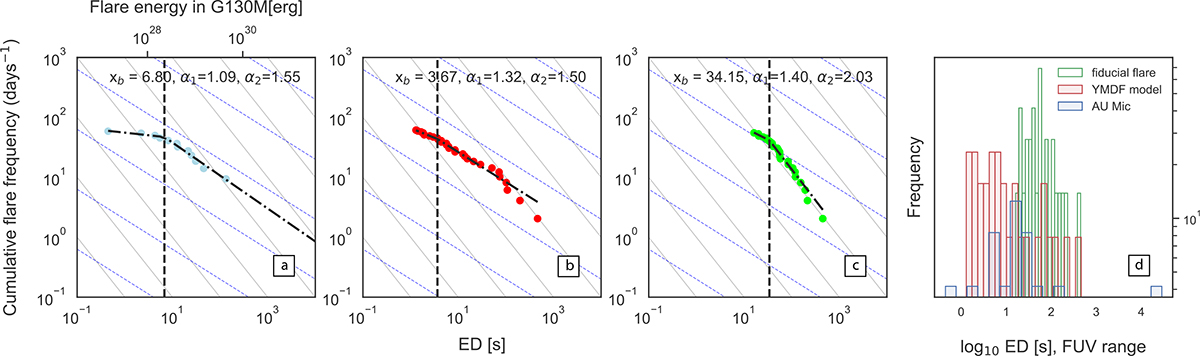
Fig. 8.
Download original image
Cumulative FFDs in the HST-COS FUV bandpass. Left: Observed data (panel ‘a’), a representative synthetic distribution generated by the YMDF model (panel ‘b’), and a representative synthetic distribution generated by the ‘fiducial flare’ model (panel ‘c’). These synthetic distributions correspond to the AU Mic observation period in FUV (∼11.7 hours). Panel ‘d’: Synthetic distributions produced over the AU Mic FUV observation period. The bars are coloured consistently with those in the preceding figure, except for corresponding to AU Mic observation period in FUV.
Current usage metrics show cumulative count of Article Views (full-text article views including HTML views, PDF and ePub downloads, according to the available data) and Abstracts Views on Vision4Press platform.
Data correspond to usage on the plateform after 2015. The current usage metrics is available 48-96 hours after online publication and is updated daily on week days.
Initial download of the metrics may take a while.