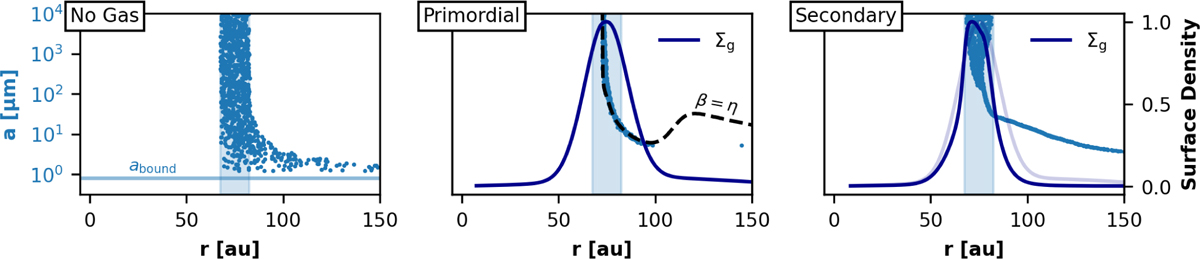
Fig. 2
Download original image
One-dimensional simulations of a dust ring. All setups included radiation pressure with β1 μm=0.4, and are shown after 150 orbits at r0. Left: simulation without gas. The horizontal line indicates the minimum particle size for which the dust remains on bound orbits, and the shaded area marks the initial radial range of the dust particles. Centre: includes gas density specified by Eq. (1), with gas density (Σg, blue curve) normalised to its maximum value, which was set to represent a gas ring of 10 M⊕, representing a primordial scenario. The dust-to-gas ratio is 0.01. The dashed curve shows where β=η. Right: same as the centre panel, but with Mgas=0.1 M⊕, and a dust-to-gas ratio of unity, reflecting a scenario of secondary gas origin. Large particles are affected by neither radiation pressure nor gas drag, and they remain on their initial circular Keplerian orbits. For sizes ≲100 μm, both gas drag and radiation pressure become efficient, and the particles move outward. The momentum feedback from the dust changes the gas density profile from its initial distribution (transparent blue line).
Current usage metrics show cumulative count of Article Views (full-text article views including HTML views, PDF and ePub downloads, according to the available data) and Abstracts Views on Vision4Press platform.
Data correspond to usage on the plateform after 2015. The current usage metrics is available 48-96 hours after online publication and is updated daily on week days.
Initial download of the metrics may take a while.