Fig. 6
Download original image
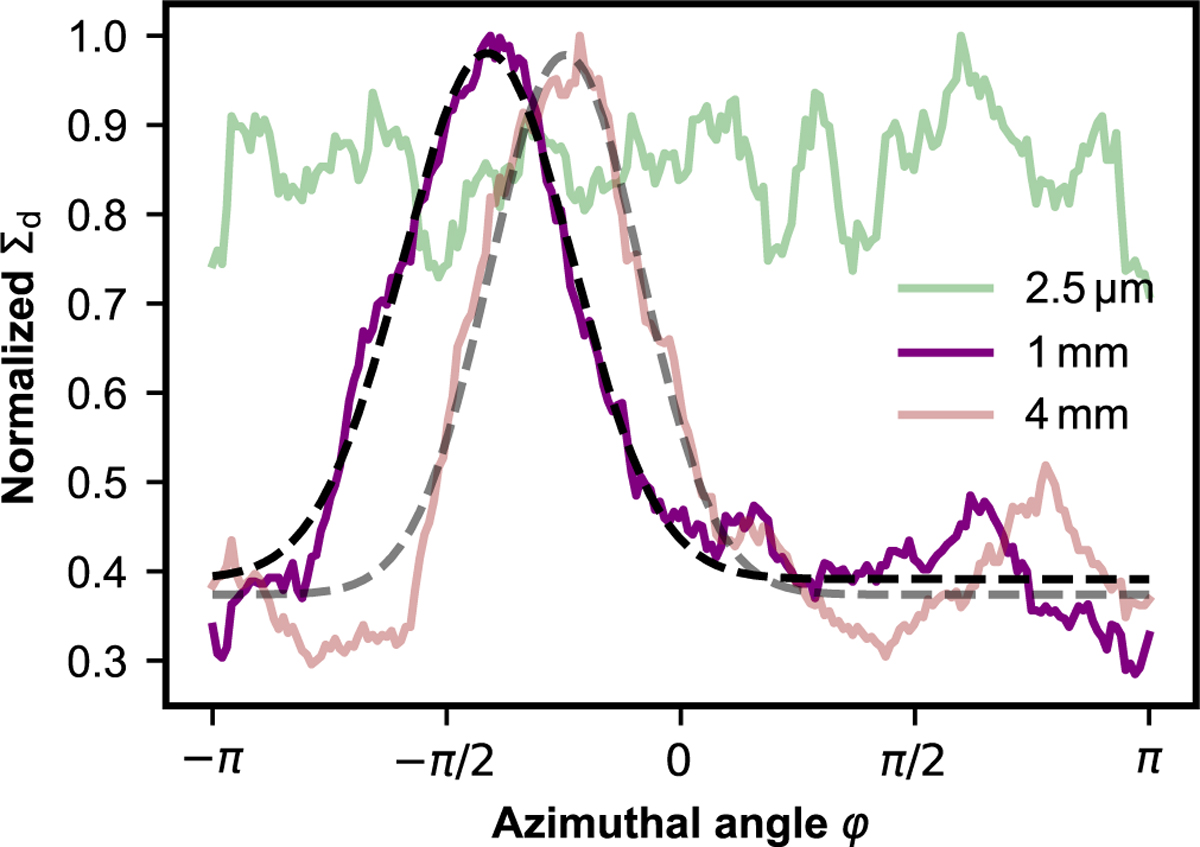
Azimuthal dust distribution for representative sizes of 2.5 μm, 1 mm and 4 mm. The profiles were produced by selecting the particles within ± 10% of the respective size over the full radial domain and normalising to the maximum value of the large grains. The dashed black curve represents a Gaussian fit to the data 1 mm profile.
Current usage metrics show cumulative count of Article Views (full-text article views including HTML views, PDF and ePub downloads, according to the available data) and Abstracts Views on Vision4Press platform.
Data correspond to usage on the plateform after 2015. The current usage metrics is available 48-96 hours after online publication and is updated daily on week days.
Initial download of the metrics may take a while.