Fig. 9
Download original image
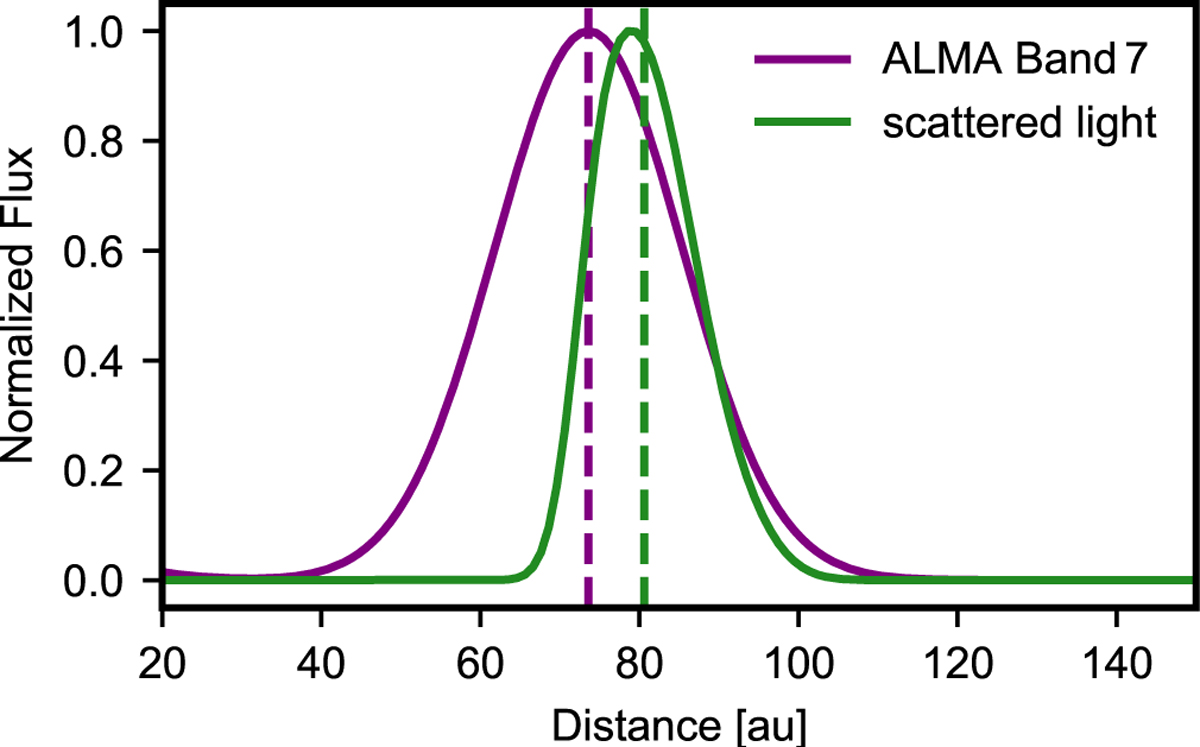
Deprojected radial intensity profiles of ALMA band 7 synthetic observation (purple, corresponding to right panel of Fig. 7) and J-band scattered light (green, corresponding to right panel of Fig. 8). The vertical dashed lines mark the corresponding maxima measured from the real observations at 73.6 au and 80.6 au for sub- mm emission and scattered light, respectively (see Milli et al. 2026).
Current usage metrics show cumulative count of Article Views (full-text article views including HTML views, PDF and ePub downloads, according to the available data) and Abstracts Views on Vision4Press platform.
Data correspond to usage on the plateform after 2015. The current usage metrics is available 48-96 hours after online publication and is updated daily on week days.
Initial download of the metrics may take a while.