Fig. 1
Download original image
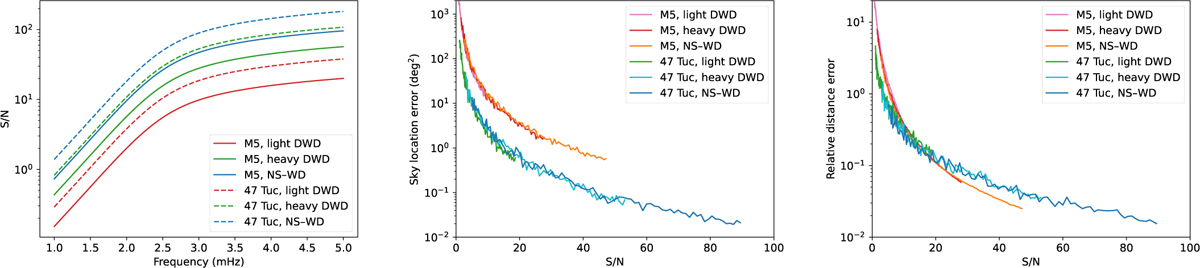
Illustrations of the relationship between the properties of a binary and its LISA measurement uncertainties, for three different test sources in two different GCs. The first panel shows how a binary’s S/N varies with its frequency. The second shows how sky location error varies with S/N, and the third how relative distance error varies with S/N.
Current usage metrics show cumulative count of Article Views (full-text article views including HTML views, PDF and ePub downloads, according to the available data) and Abstracts Views on Vision4Press platform.
Data correspond to usage on the plateform after 2015. The current usage metrics is available 48-96 hours after online publication and is updated daily on week days.
Initial download of the metrics may take a while.