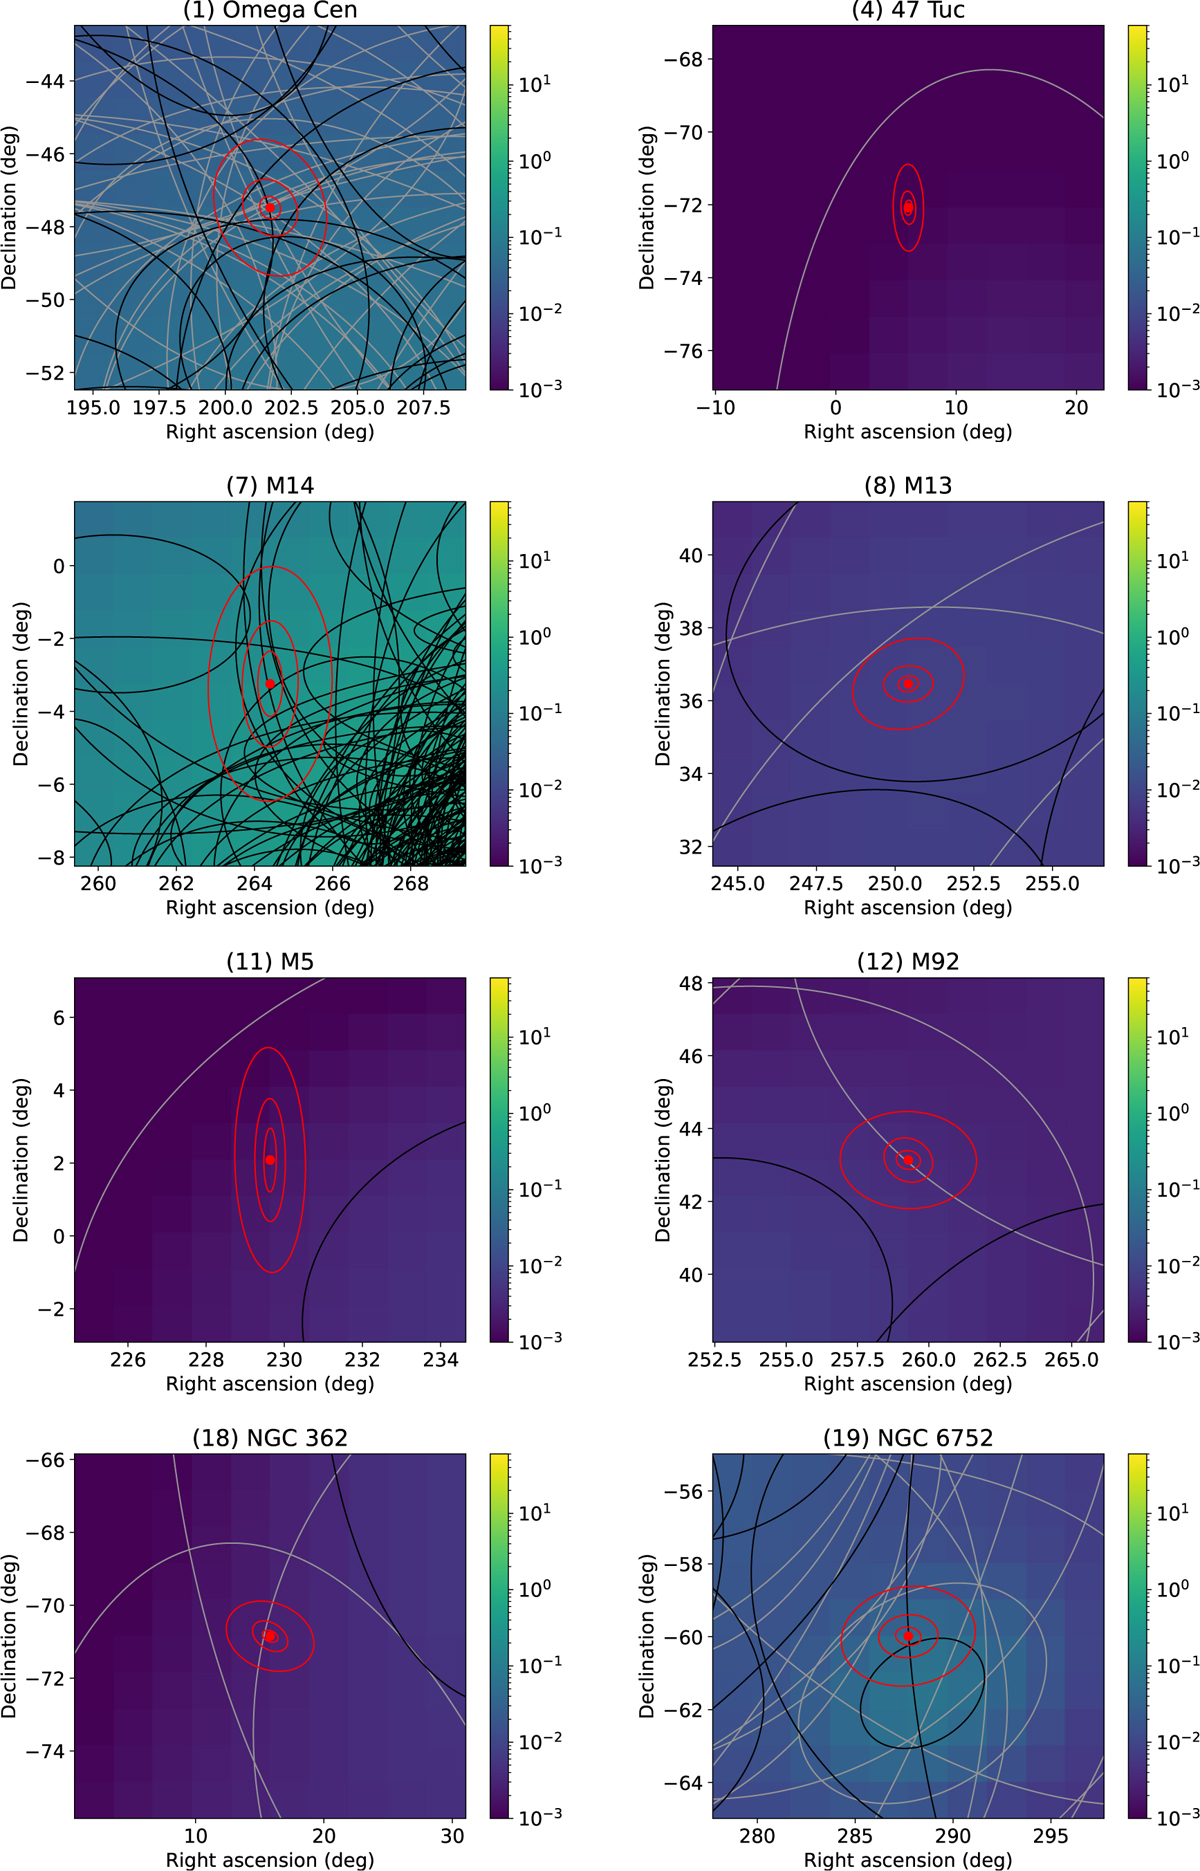
Fig. 3
Download original image
10° grid plots for GCs with <500 overlapping sources. The red dot marks the location of the GC, and the red ellipses are the 1σ error ellipses for test binaries in the GC with S/N=10,20,40. The black ellipses are 1σ for MW disc binaries, and the grey ellipses are 2σ. The 2σ ellipses are omitted for M14 (panel 7) to reduce clutter. The background colours indicate the expected number of MW disc binaries in each cell based on their sky location uncertainty distributions.
Current usage metrics show cumulative count of Article Views (full-text article views including HTML views, PDF and ePub downloads, according to the available data) and Abstracts Views on Vision4Press platform.
Data correspond to usage on the plateform after 2015. The current usage metrics is available 48-96 hours after online publication and is updated daily on week days.
Initial download of the metrics may take a while.