Fig. 5
Download original image
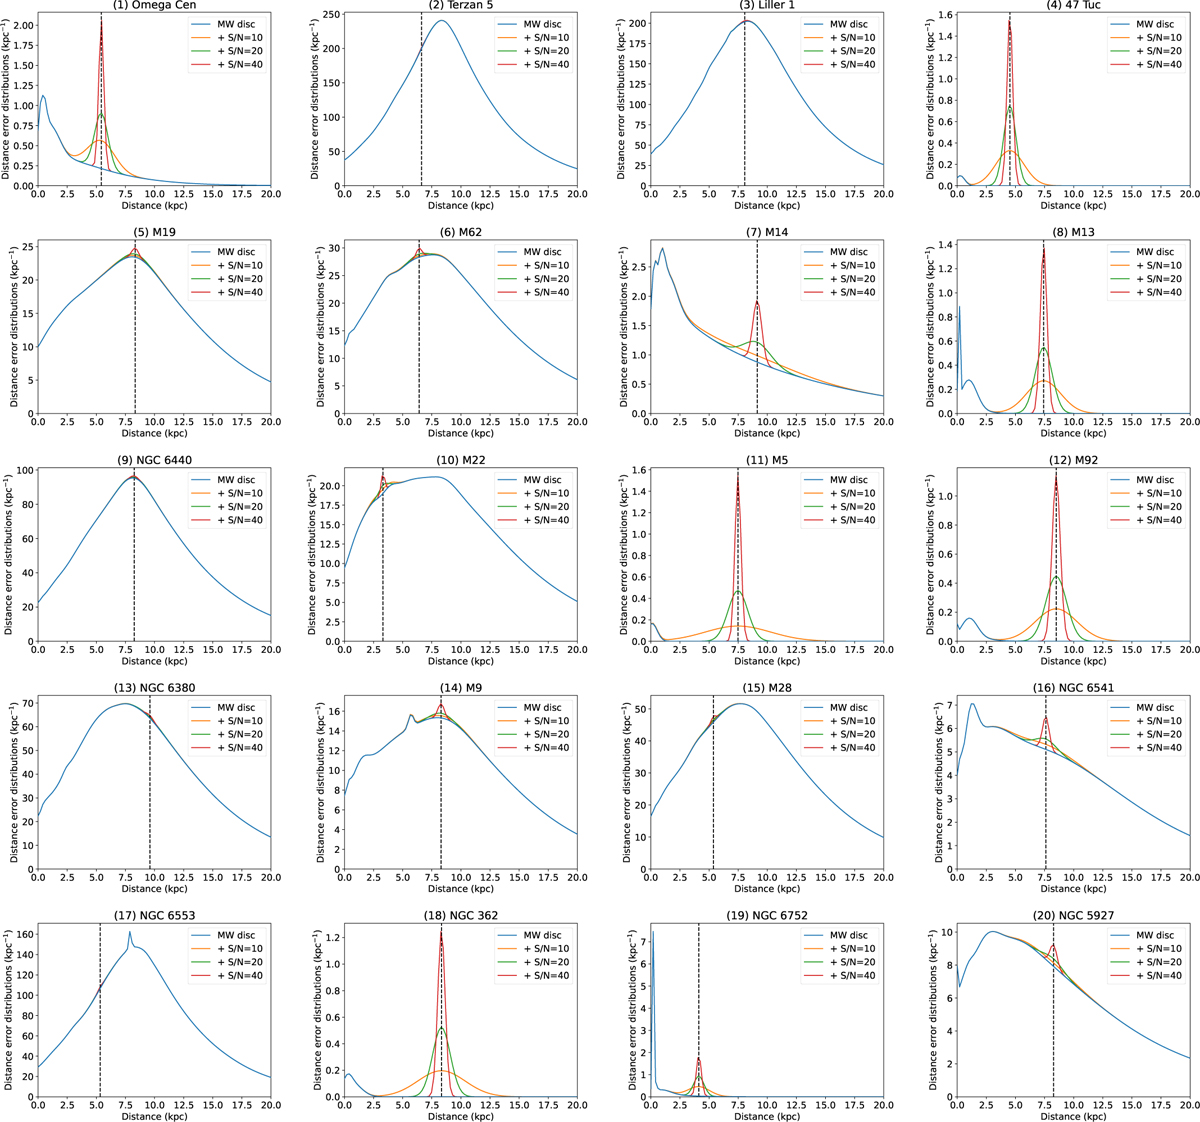
Comparison of distance error distributions between test binaries within a GC and the overlapping MW disc DWDs, for each of the 20 GCs in our sample. The blue lines are the weighted sums of the distance distributions of the overlapping MW DWDs for each GC. The other coloured lines add to this distribution a test binary at the distance of the GC with a certain S/N. The dashed black lines mark the distance of each GC.
Current usage metrics show cumulative count of Article Views (full-text article views including HTML views, PDF and ePub downloads, according to the available data) and Abstracts Views on Vision4Press platform.
Data correspond to usage on the plateform after 2015. The current usage metrics is available 48-96 hours after online publication and is updated daily on week days.
Initial download of the metrics may take a while.