Fig. B.1
Download original image
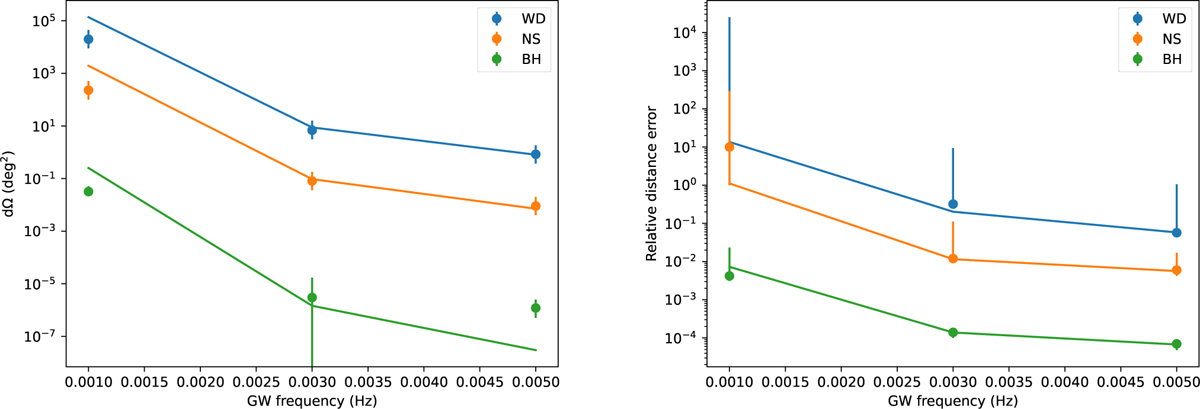
Comparing sky location and distance errors of GW-emitting binaries between GWToolbox and Colpi et al. (2024). The points show the data in Table 3.1 of Colpi et al. (2024): the sky location and distance errors of three example binaries. The lines show the errors for the same binaries as computed by GWToolbox, assuming an inclination of 0.6 π rad. The left plot shows the sky location error in deg2, and the right plot shows the relative distance error (the distance error divided by the binary’s distance itself). Full details on the example binaries can be found in Table 3.1 of Colpi et al. (2024).
Current usage metrics show cumulative count of Article Views (full-text article views including HTML views, PDF and ePub downloads, according to the available data) and Abstracts Views on Vision4Press platform.
Data correspond to usage on the plateform after 2015. The current usage metrics is available 48-96 hours after online publication and is updated daily on week days.
Initial download of the metrics may take a while.