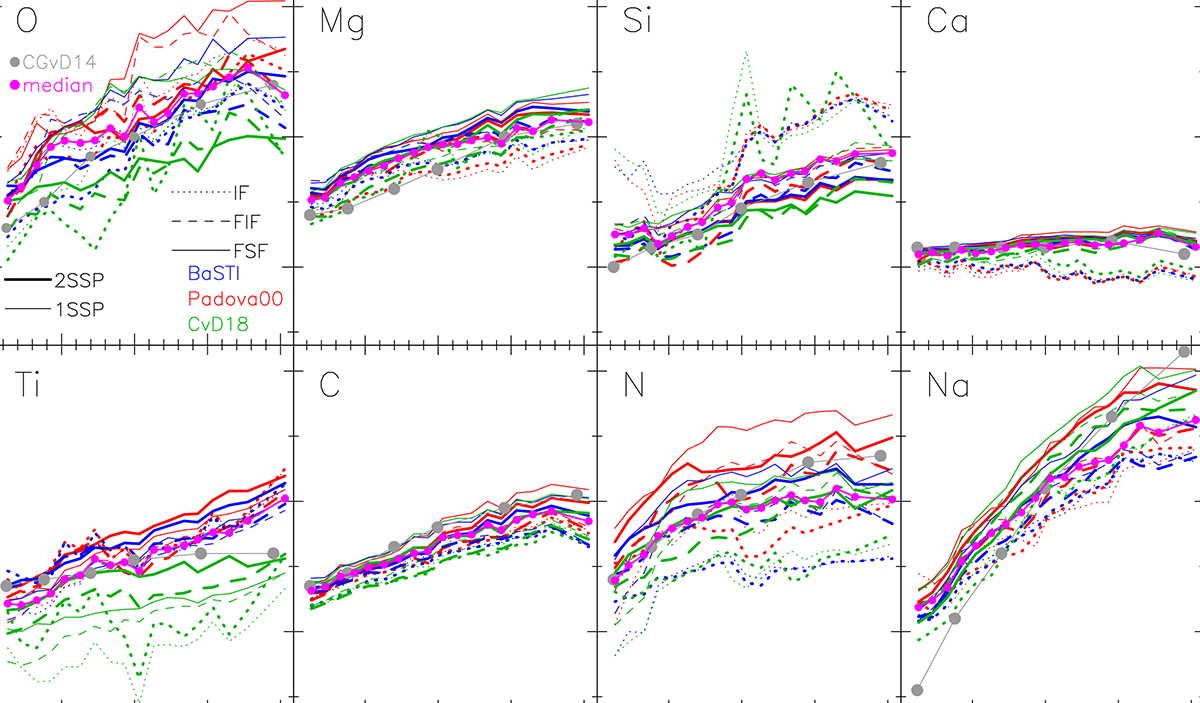
Fig. C.1.
Download original image
Abundance ratios versus velocity dispersion, σ, for SDSS stacked spectra of ETGs (see the text for details). Each panel corresponds to a different element, as labeled. Thin and thick lines show results obtained by fitting 1SSP and 2SSP models, respectively. Dotted, dashed, and solid lines denote different fitting techniques. Different models are shown in different colors, i.e., blue for E-MILES BaSTI, red for E-MILES Padova00, and green for CvD18. Gray dots show the [X/Fe] versus σ trend from Conroy et al. (2014), based on a different set of SDSS stacked spectra.
Current usage metrics show cumulative count of Article Views (full-text article views including HTML views, PDF and ePub downloads, according to the available data) and Abstracts Views on Vision4Press platform.
Data correspond to usage on the plateform after 2015. The current usage metrics is available 48-96 hours after online publication and is updated daily on week days.
Initial download of the metrics may take a while.