Fig. F.2.
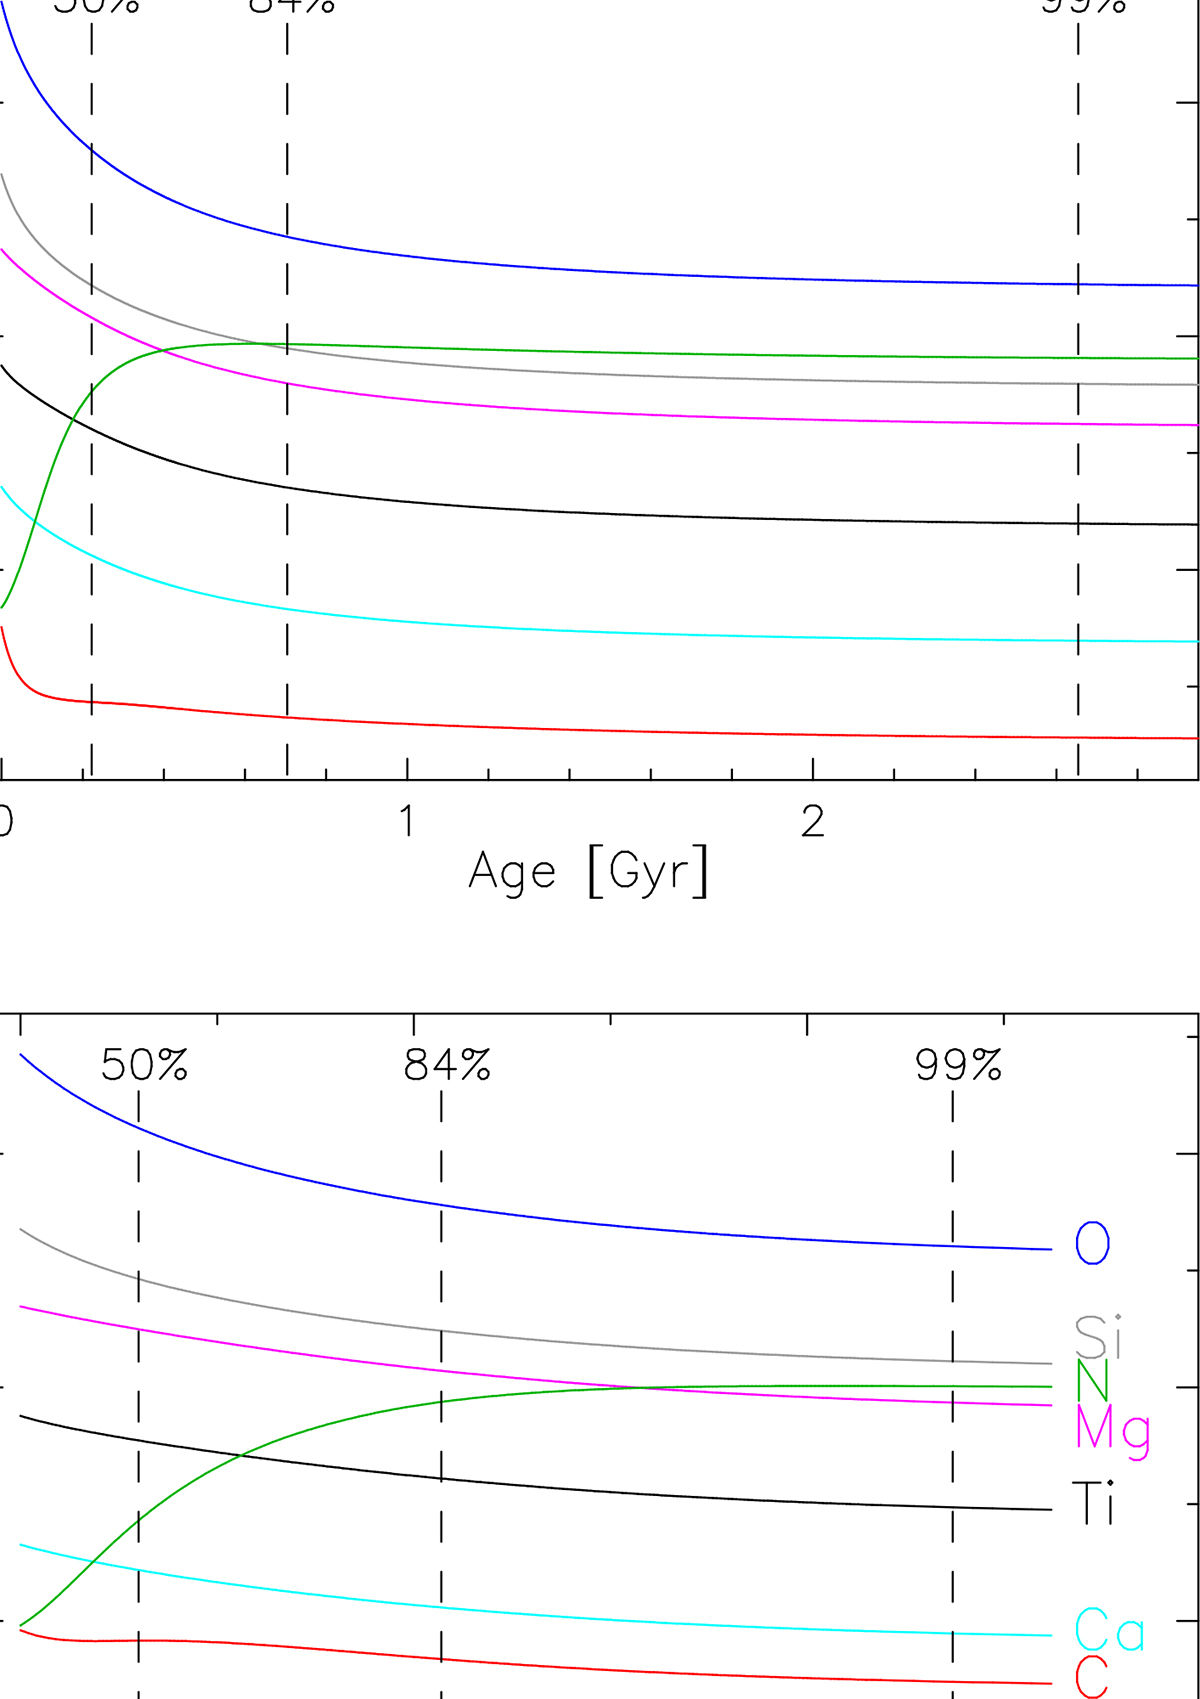
Download original image
Examples of the evolution of abundance ratios with age for our outside-in chemical evolution model based on F04 yields. The top and bottom panels show results at R = 0 and R = 600 pc, respectively (see Tab. 1). Different colors correspond to different elements (see bottom panel), as in Fig. 6. Dashed vertical lines mark the ages where the models reach 50, 84, and 99% of the total stellar mass formed. In the bottom panel, the curves end at the age where the cumulative mass fraction reaches 100%.
Current usage metrics show cumulative count of Article Views (full-text article views including HTML views, PDF and ePub downloads, according to the available data) and Abstracts Views on Vision4Press platform.
Data correspond to usage on the plateform after 2015. The current usage metrics is available 48-96 hours after online publication and is updated daily on week days.
Initial download of the metrics may take a while.