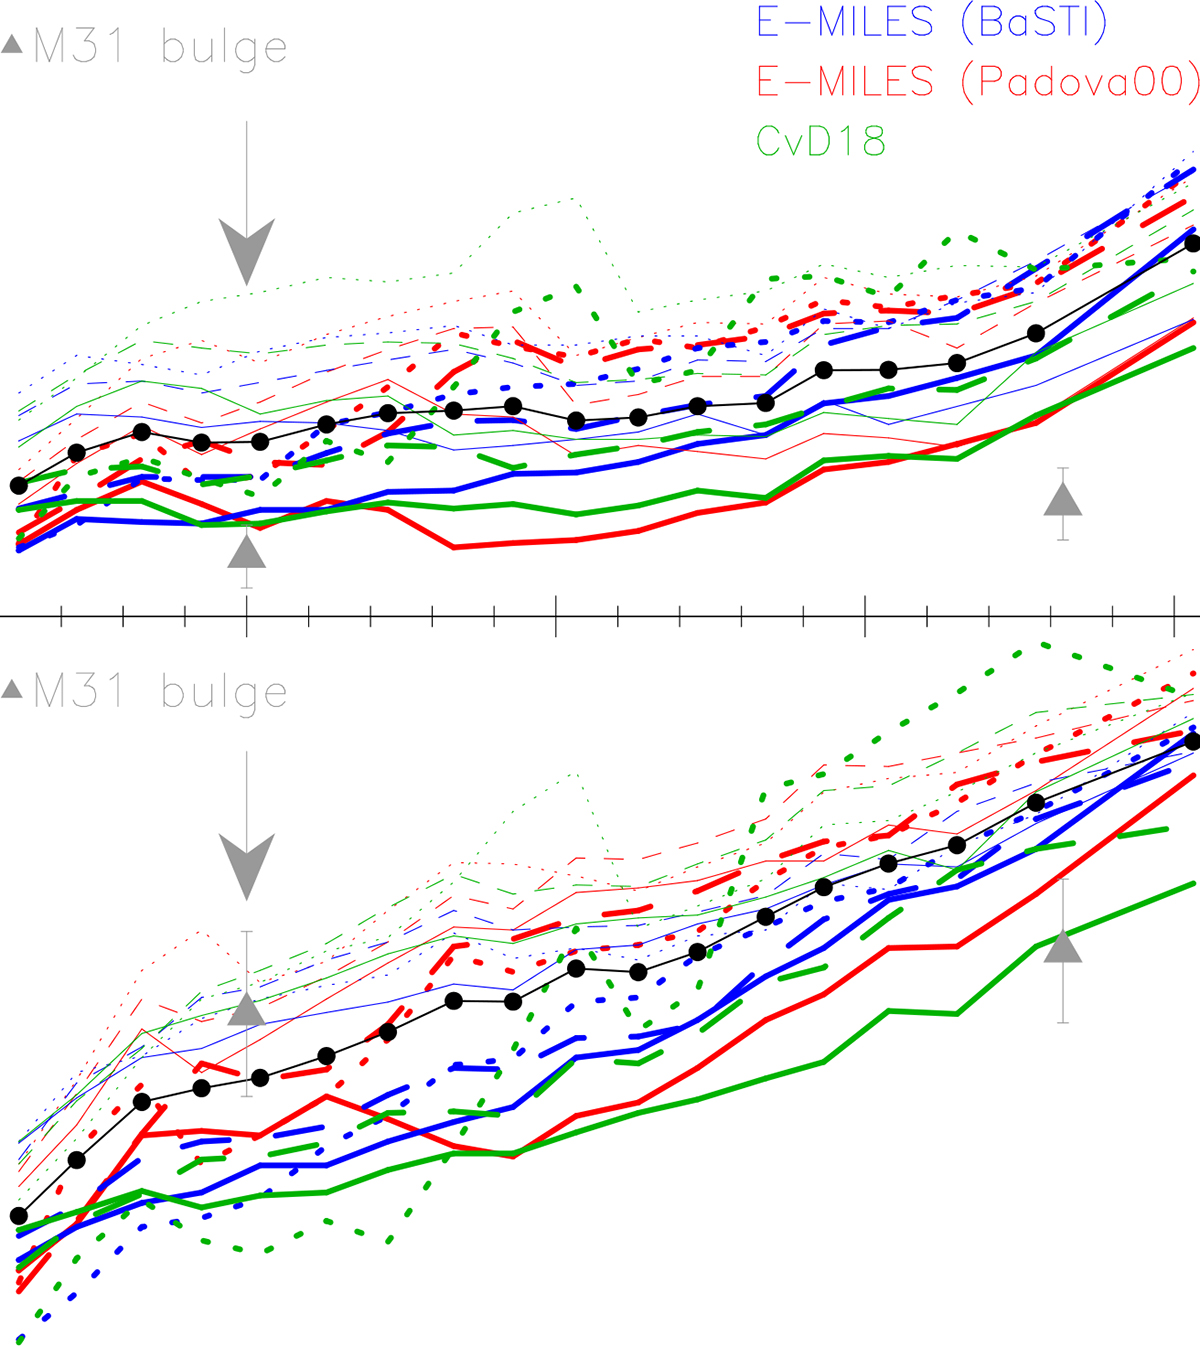
Fig. 2.
Download original image
Same as Fig. 1, but plotting the metallicity profiles of ETGs stacked spectra as a function of velocity dispersion σ. The velocity dispersion of the M31 bulge (σ ∼ 150 km s−1) is marked with a vertical gray arrow in both panels. The gray triangles with error bars, at σ ∼ 150 km s−1 and σ ∼ 280 km s−1, show the estimates of [Fe/H] and [M/H] obtained by mimicking the Sloan fiber aperture for low- and high-σ ETGs (see the text).
Current usage metrics show cumulative count of Article Views (full-text article views including HTML views, PDF and ePub downloads, according to the available data) and Abstracts Views on Vision4Press platform.
Data correspond to usage on the plateform after 2015. The current usage metrics is available 48-96 hours after online publication and is updated daily on week days.
Initial download of the metrics may take a while.