Fig. 3.
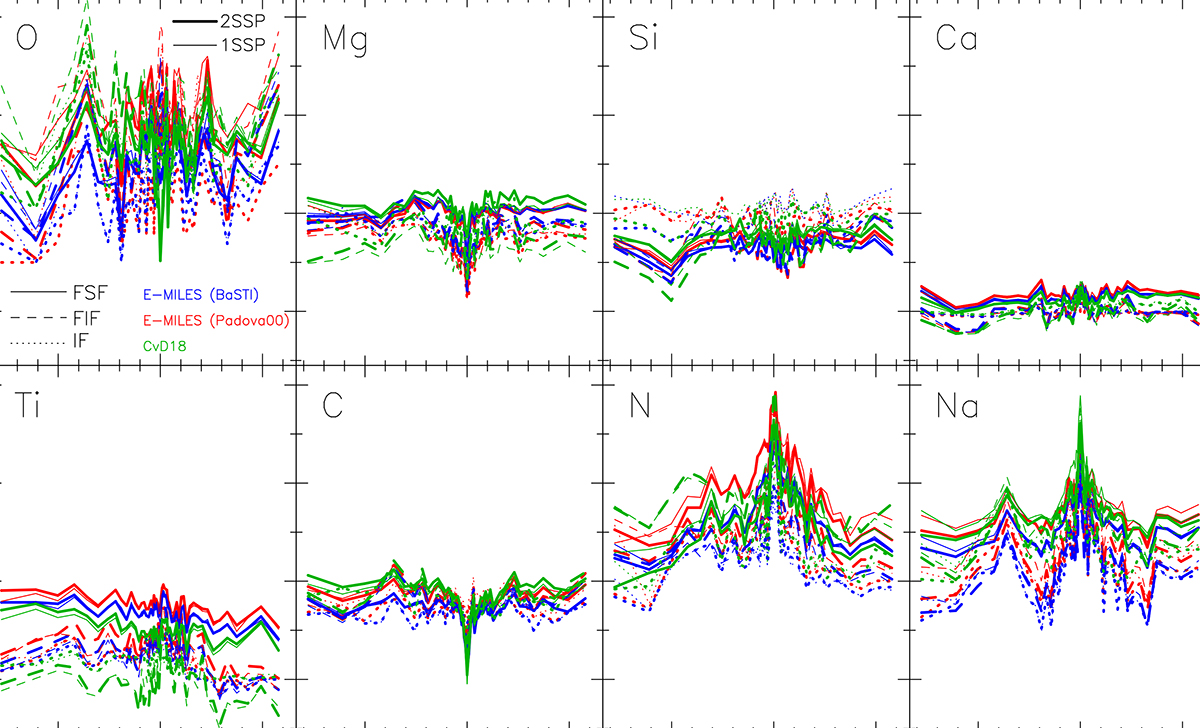
Download original image
Individual abundance ratios as a function of galactocentric distance, R, for the bulge of M31. Positive and negative values of R refer to different sides of the slit. From left to right, and top to bottom, α elements elements are shown first, namely O, Mg, Si, Ca, and Ti (in order of decreasing atomic number), followed by C, N, and Na. Lines with different colors refer to E-MILES BaSTI (blue) and Padova00 (red), and Cvd18 models (green), respectively. Thick and thin lines are for 1SSP and 2SSP models, respectively, while solid, dashed, and dotted lines plot results of different methods, i.e., full-spectral fitting, full-index fitting, and index fitting, respectively, as shown by the labels in the top–left panel.
Current usage metrics show cumulative count of Article Views (full-text article views including HTML views, PDF and ePub downloads, according to the available data) and Abstracts Views on Vision4Press platform.
Data correspond to usage on the plateform after 2015. The current usage metrics is available 48-96 hours after online publication and is updated daily on week days.
Initial download of the metrics may take a while.