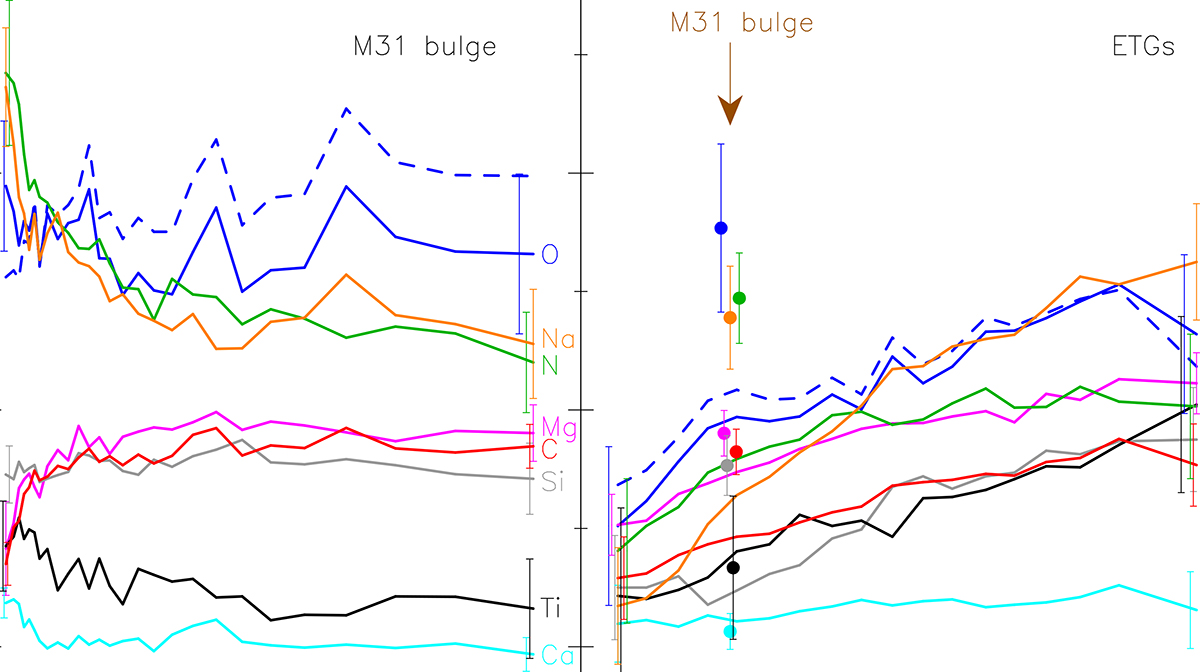
Fig. 4.
Download original image
Median values of abundance ratios, obtained from different models and methods as a function of (left) galactocentric distance, R, for the bulge of M31, and (right) galaxy velocity dispersion for stacked spectra of ETGs. In both plots, different colors refer to different chemical elements (see labels in the left panel). Dashed blue curves show [O/Fe] abundances corrected for the Milky Way pattern (see the text). In each panel, error bars are plotted only for the end points. In the right panel, dots with error bars mark abundance estimates obtained by mimicking the Sloan fiber aperture (see the text) for the M31 bulge (see brown arrow). For clarity, small horizontal shifts have been applied to the symbols (error bars and dots) corresponding to different elements.
Current usage metrics show cumulative count of Article Views (full-text article views including HTML views, PDF and ePub downloads, according to the available data) and Abstracts Views on Vision4Press platform.
Data correspond to usage on the plateform after 2015. The current usage metrics is available 48-96 hours after online publication and is updated daily on week days.
Initial download of the metrics may take a while.