Fig. 5.
Download original image
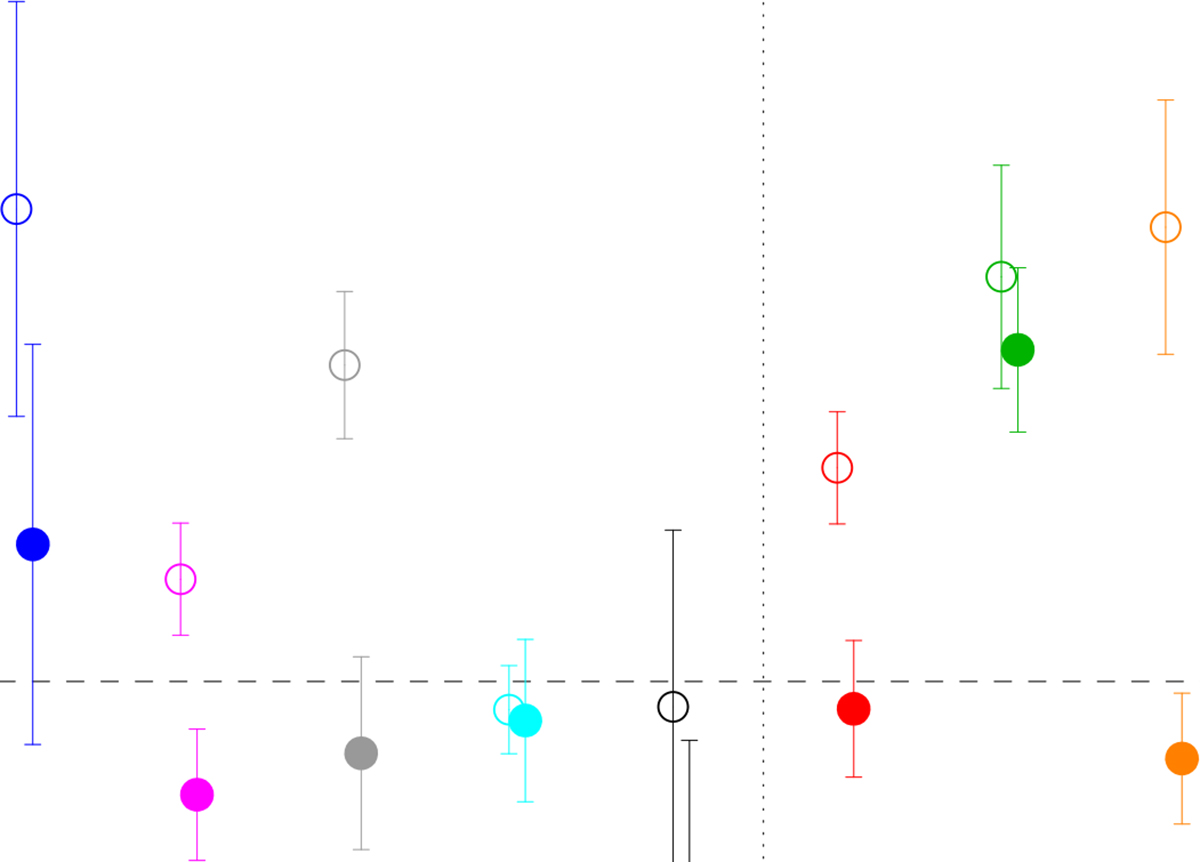
Median difference in abundance ratios between the bulge of M31 and stacked spectra of ETGs for different elements, as shown on the x-axis. Median values and error bars are derived from different models and fitting methods (see the text). Different elements are color-coded as in Fig. 4. Empty and filled symbols denote ETGs with low- (σ = 150 km s−1) and high- (σ > 260 kms) velocity dispersions, respectively, as indicated in the lower-left corner. The horizontal dashed line marks a difference of zero, while the vertical dotted line separates the α-elements (left) from the remaining ones (right).
Current usage metrics show cumulative count of Article Views (full-text article views including HTML views, PDF and ePub downloads, according to the available data) and Abstracts Views on Vision4Press platform.
Data correspond to usage on the plateform after 2015. The current usage metrics is available 48-96 hours after online publication and is updated daily on week days.
Initial download of the metrics may take a while.