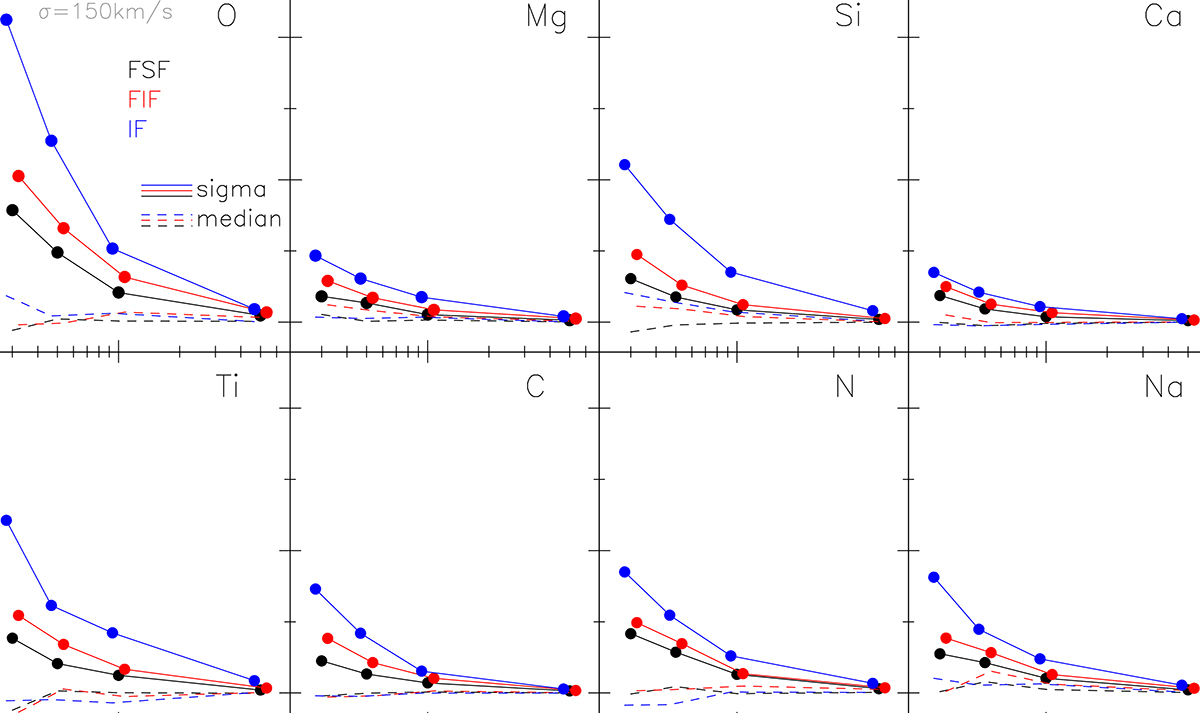
Fig. A.1.
Download original image
Results of simulations for low-mass ETGs (σ = 150 km s−1; see the text), showing the ability to recover individual abundance ratios as a function of S/N ratio, using different techniques, i.e., full spectral fitting (black), full-index fitting (red), and index fitting (blue), as labeled in the top–left panel. In each panel, solid lines with filled circles represent the 1–sigma uncertainties on abundance ratios, while dashed lines show the average difference between recovered and input values. Each panel corresponds to a different element, arranged in the same order as in Fig. 3.
Current usage metrics show cumulative count of Article Views (full-text article views including HTML views, PDF and ePub downloads, according to the available data) and Abstracts Views on Vision4Press platform.
Data correspond to usage on the plateform after 2015. The current usage metrics is available 48-96 hours after online publication and is updated daily on week days.
Initial download of the metrics may take a while.