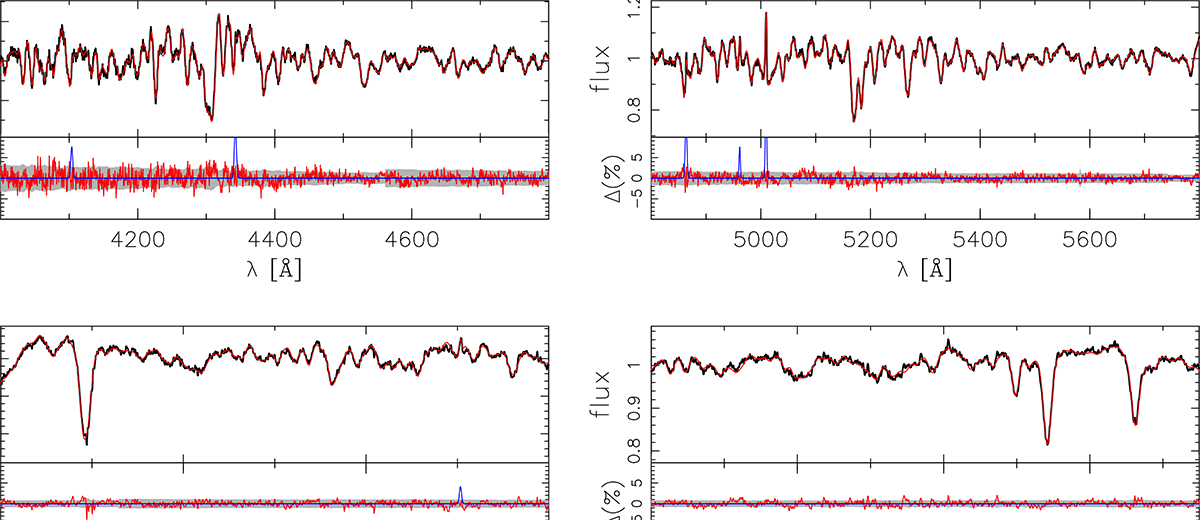
Fig. B.1.
Download original image
Example of full-spectral fitting for one of the M31 spectra. The four panels correspond to the spectral ranges defined in Sect. 4. In each panel, the upper subplot shows the observed spectrum (black) and the best-fitting model (red), both normalized by the best-fitting multiplicative polynomial, while the lower subplot shows the relative residuals (observed minus model), the ±1-sigma uncertainties (gray shaded regions), and the best-fitting model for the emission lines (blue curves).
Current usage metrics show cumulative count of Article Views (full-text article views including HTML views, PDF and ePub downloads, according to the available data) and Abstracts Views on Vision4Press platform.
Data correspond to usage on the plateform after 2015. The current usage metrics is available 48-96 hours after online publication and is updated daily on week days.
Initial download of the metrics may take a while.