Open Access
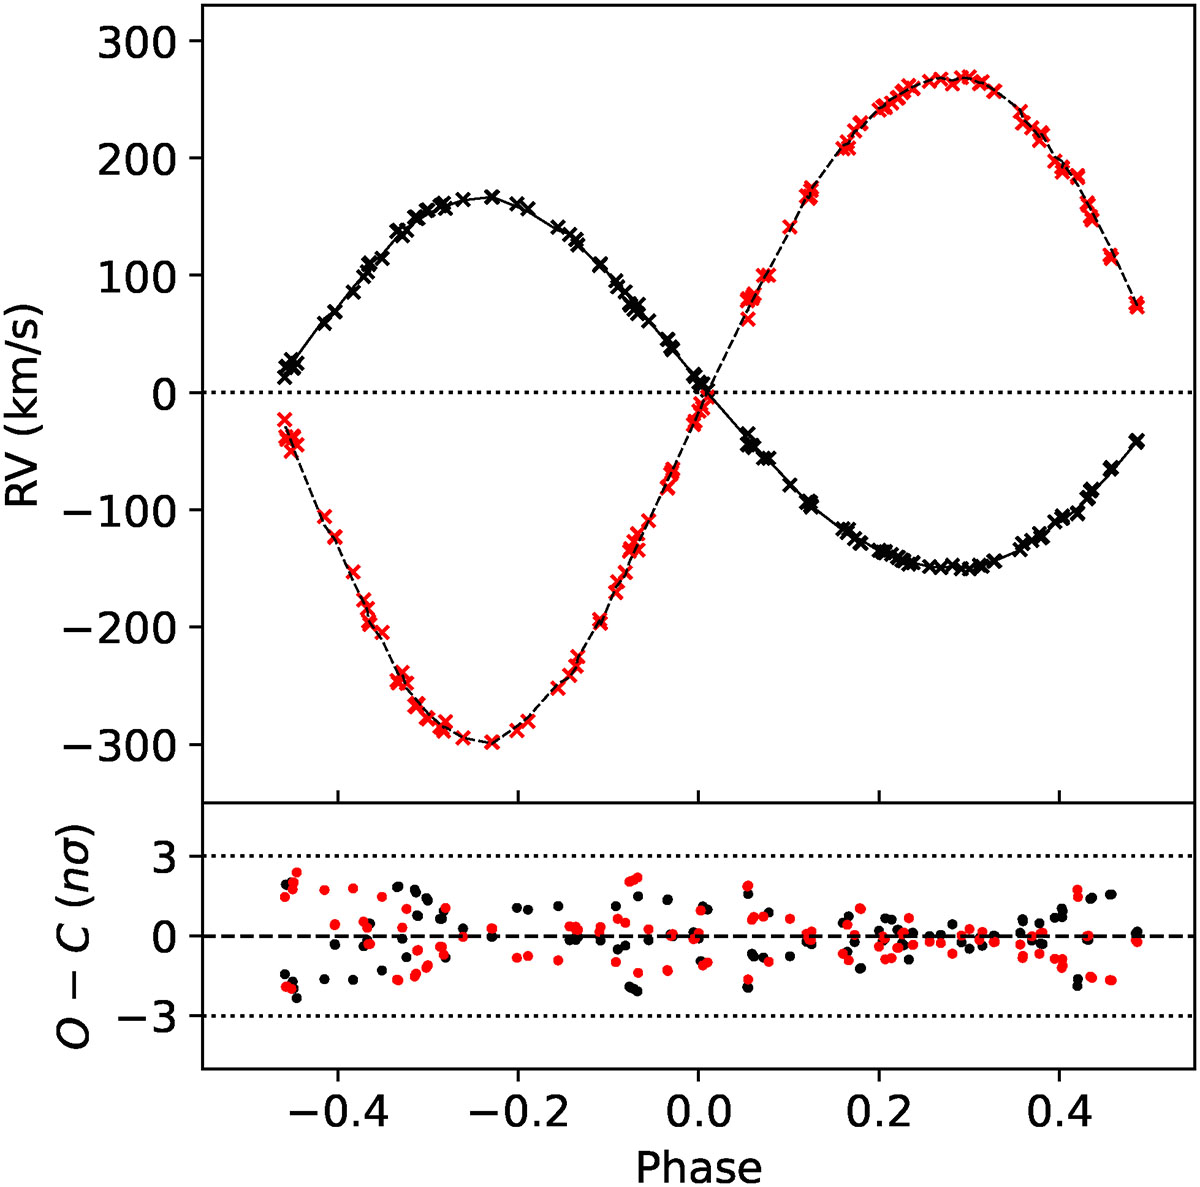
Fig. 4.
Download original image
Upper: RV curve of the inner orbit. Black x-signs denote the RVs of the primary, and the red x-signs denote the RVs of the secondary. The error bars are too small to be visible. The systemic velocity, vγ, has been subtracted from the RVs. Lower: O − C residuals in the units of σ for each individual point.
Current usage metrics show cumulative count of Article Views (full-text article views including HTML views, PDF and ePub downloads, according to the available data) and Abstracts Views on Vision4Press platform.
Data correspond to usage on the plateform after 2015. The current usage metrics is available 48-96 hours after online publication and is updated daily on week days.
Initial download of the metrics may take a while.