Open Access
Fig. 1.
Download original image
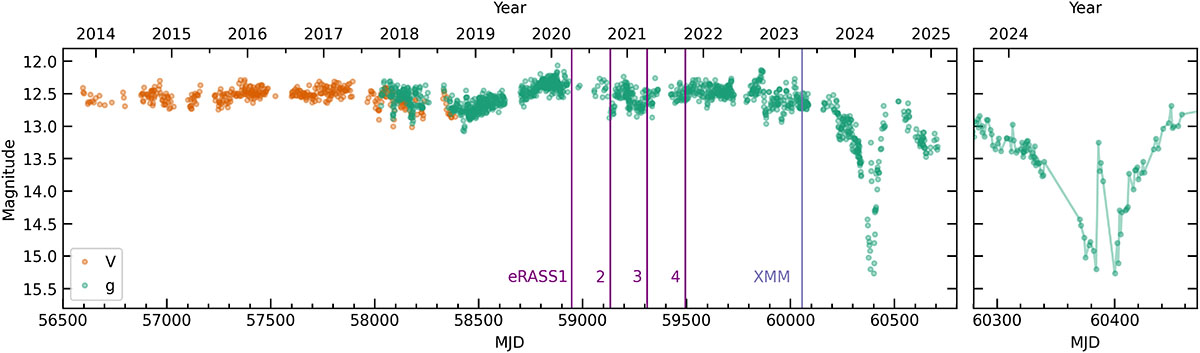
Left panel: Long-term ASAS-SN light curve of SRGt 062340, combining V- and g-band magnitudes. The purple vertical lines indicate the epochs of the eROSITA observations, while the lilac line marks the epoch of the XMM-Newton observation. Right panel: Detailed view of the light curve between MJD 60280 and MJD 60470.
Current usage metrics show cumulative count of Article Views (full-text article views including HTML views, PDF and ePub downloads, according to the available data) and Abstracts Views on Vision4Press platform.
Data correspond to usage on the plateform after 2015. The current usage metrics is available 48-96 hours after online publication and is updated daily on week days.
Initial download of the metrics may take a while.