Fig. 4.
Download original image
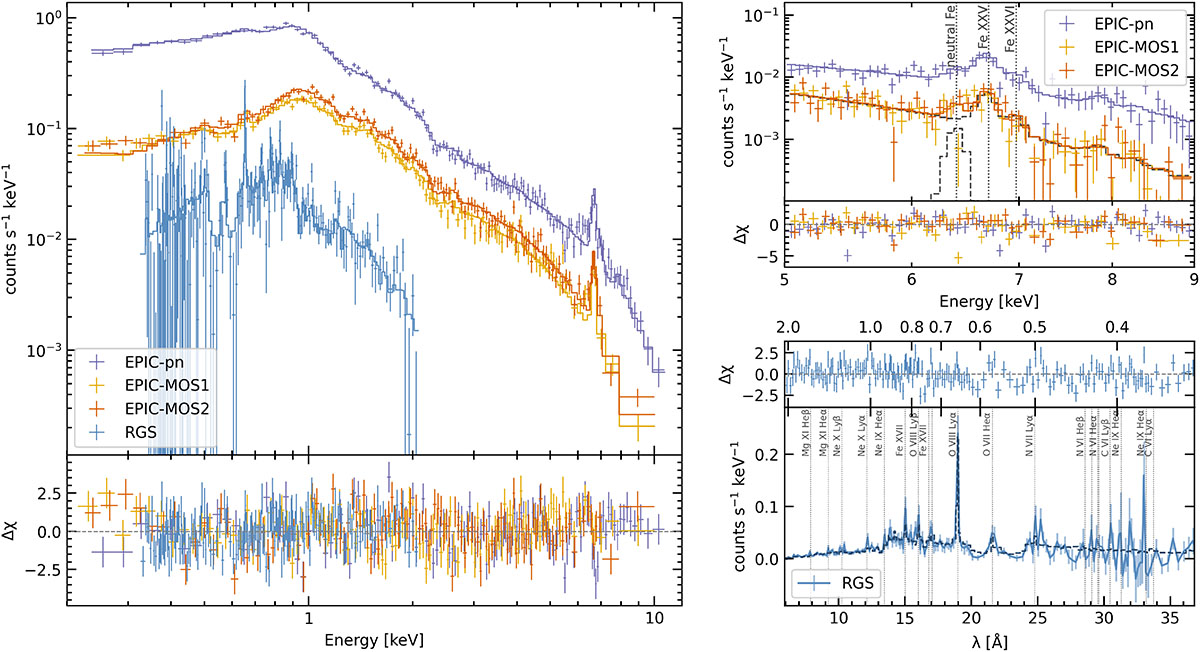
Left panel: XMM-Newton energy spectra of SRGt 062340, shown with the best-fitting model (TBabs*(apec+apec+apec)). The bottom panel shows the normalised residuals. The best-fit parameters are listed in Table 4. Top right panel: Zoomed-in image of the Fe K complex, fitted with a TBabs*(apec+gaussian) model. The dashed lines represent the model components for the EPIC-MOS1 spectrum, shown as an example. The vertical dotted lines mark the expected energies of the different Fe-line components. Bottom right panel: RGS spectrum and best-fitting model, identical to those shown in the left panel, but plotted as a function of wavelength. The vertical lines indicate several prominent and commonly observed transitions.
Current usage metrics show cumulative count of Article Views (full-text article views including HTML views, PDF and ePub downloads, according to the available data) and Abstracts Views on Vision4Press platform.
Data correspond to usage on the plateform after 2015. The current usage metrics is available 48-96 hours after online publication and is updated daily on week days.
Initial download of the metrics may take a while.