Fig. 6.
Download original image
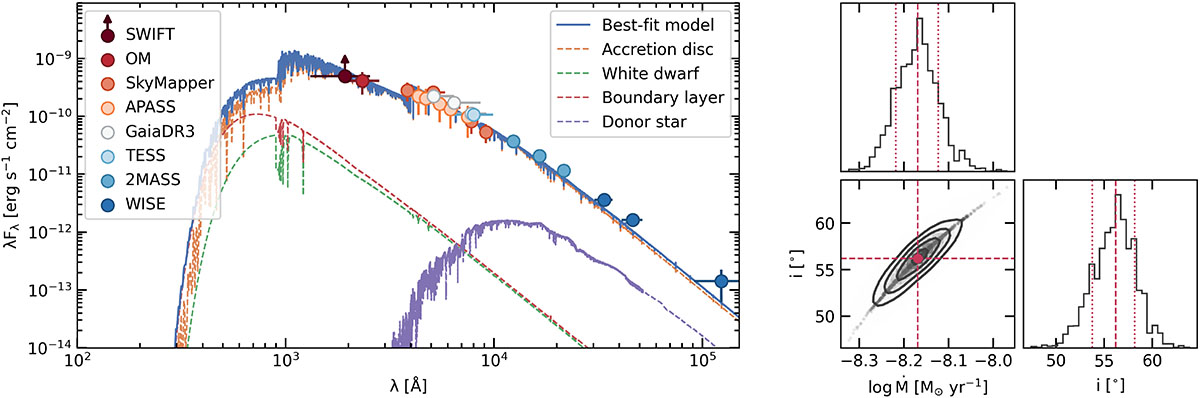
Left panel: SED of SRGt 062340 as a function of wavelength, shown with the best-fitting model including contributions from the accretion disc, white dwarf, boundary layer, and donor star. Right panel: Corner plot of the posterior distributions from the SED fit, showing the joint and marginal probability densities for the mass-accretion rate (Ṁ) and system inclination (i). The diagonal panels display the 1D marginalised Bayesian posteriors; the red dashed lines mark the median values and the red dotted lines indicate the 68% (1σ for a Gaussian distribution) credible intervals. The off-diagonal panel shows the 2D joint contours at the nominal 68%, 95%, and 99.7% (1σ, 2σ, and 3σ for a Gaussian distribution) credible intervals, illustrating the covariance between log(Ṁ) and i.
Current usage metrics show cumulative count of Article Views (full-text article views including HTML views, PDF and ePub downloads, according to the available data) and Abstracts Views on Vision4Press platform.
Data correspond to usage on the plateform after 2015. The current usage metrics is available 48-96 hours after online publication and is updated daily on week days.
Initial download of the metrics may take a while.