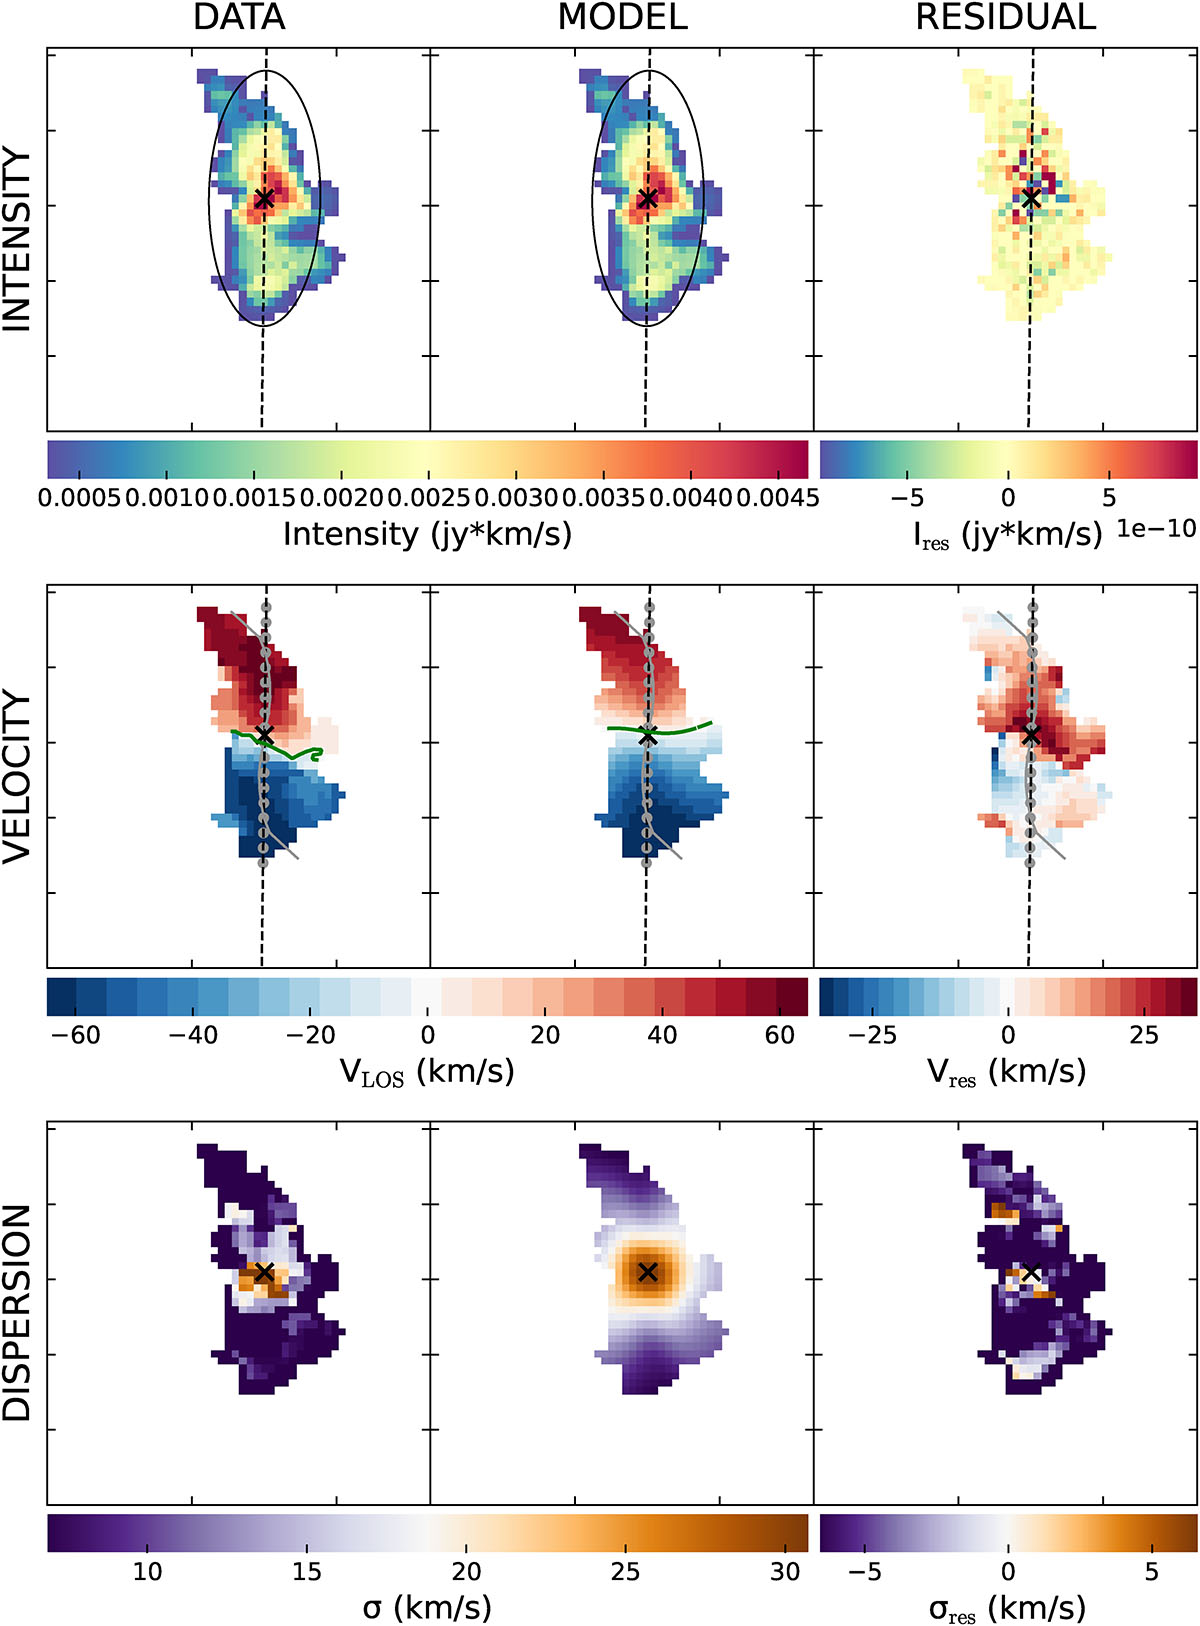
Fig. A.2.
Download original image
Model obtained with the 3DBAROLO code (Di Teodoro & Fraternali 2015) for low-resolution (∼ 17″) data cube. From left to right: Observational data, model obtained with 3DBAROLO, and residuals after subtracting the model from the observational data. From top to bottom: HI line intensity, velocity field, and velocity dispersion.
Current usage metrics show cumulative count of Article Views (full-text article views including HTML views, PDF and ePub downloads, according to the available data) and Abstracts Views on Vision4Press platform.
Data correspond to usage on the plateform after 2015. The current usage metrics is available 48-96 hours after online publication and is updated daily on week days.
Initial download of the metrics may take a while.