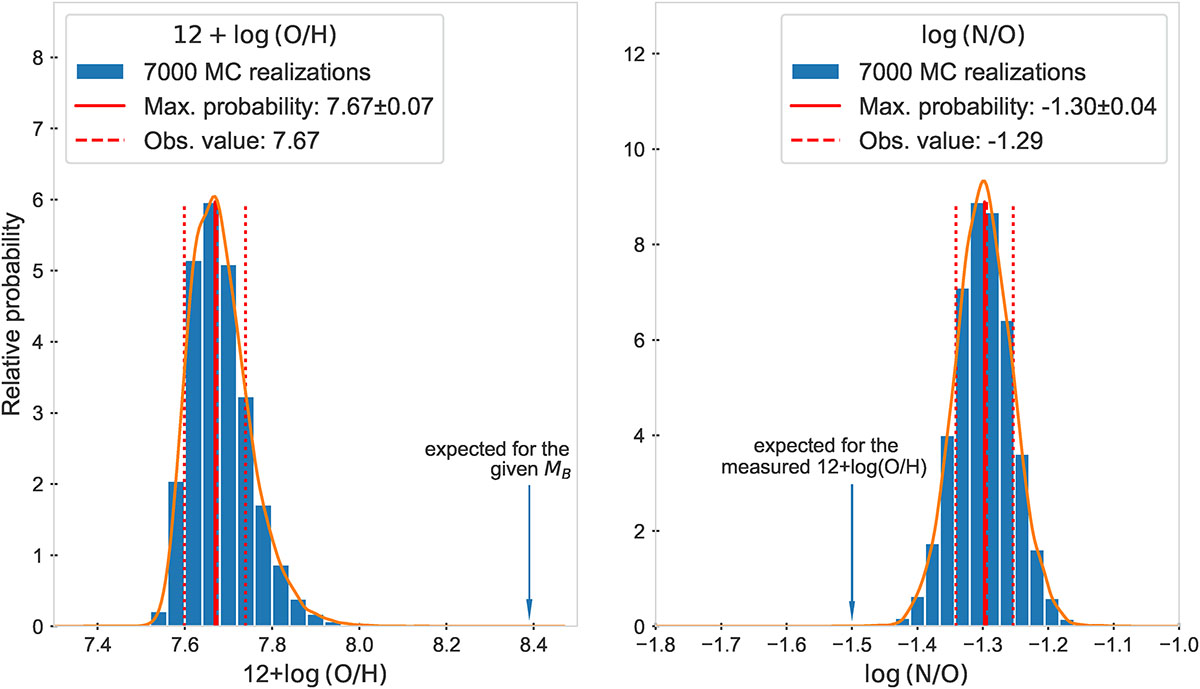
Fig. B.1.
Download original image
Results of Monte Carlo simulations to estimate the uncertainty in our measurements of 12 + log(O/H) (left panel) and log(N/O) (right panel). The histograms show the distribution of 7000 Monte Carlo realisations results, the red dashed line marks the value obtained with PYNEB, the red solid line and dotted lines mark the position of maximum probability of the Monte Carlo results and its standard deviation, respectively. The blue arrow marks 12 + log(O/H) expected for the given luminosity according to the metallicity–luminosity relation by Berg et al. (2012, see our Fig. 7), and log(N/O) expected for the observed oxygen abundance according to the N/O versus O/H diagram (see Fig. 8).
Current usage metrics show cumulative count of Article Views (full-text article views including HTML views, PDF and ePub downloads, according to the available data) and Abstracts Views on Vision4Press platform.
Data correspond to usage on the plateform after 2015. The current usage metrics is available 48-96 hours after online publication and is updated daily on week days.
Initial download of the metrics may take a while.