Fig. 2.
Download original image
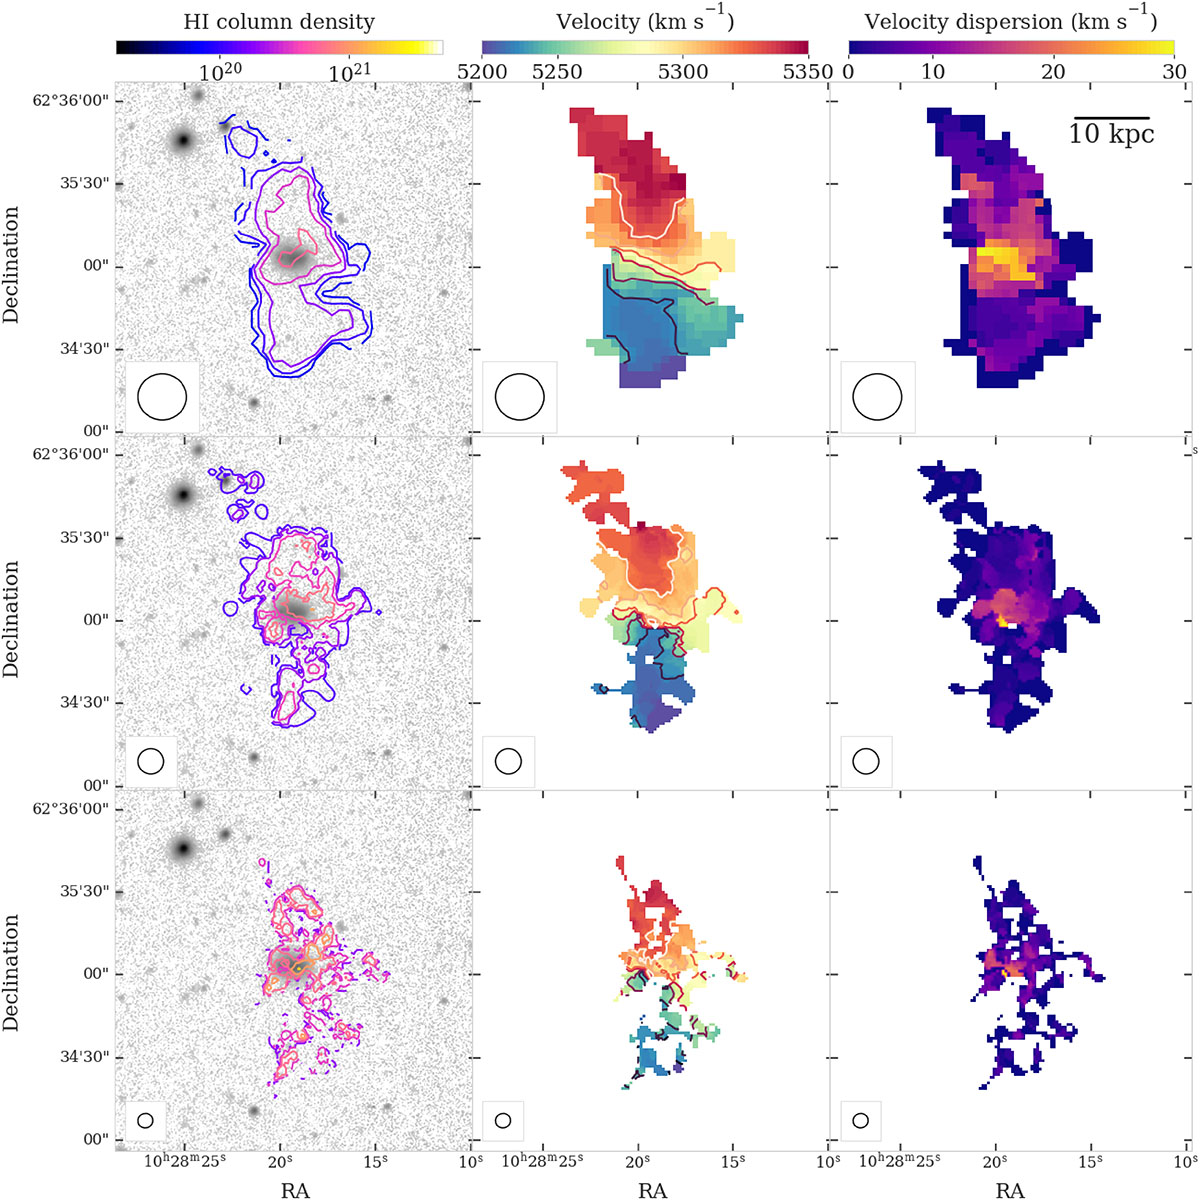
H I moment maps for VGS 12 at three distinct resolutions: ∼17″ (top row), ∼9″ (middle row), and ∼5″ (bottom row). The left panels show the H I contours overlaid on DECaLS g-band optical images. The plotted H I contours, starting at the 2σ level, are 3.7 × 10¹⁹ × (![]() atoms cm−2, n = 0, 1, 2, 3,...at 17″, 7.4 × 10¹⁹ × (
atoms cm−2, n = 0, 1, 2, 3,...at 17″, 7.4 × 10¹⁹ × (![]() atoms cm−2, n = 0, 1, 2, 3,...at 9″, and 20.3 × 10¹⁹ × (
atoms cm−2, n = 0, 1, 2, 3,...at 9″, and 20.3 × 10¹⁹ × (![]() atoms cm−2, n = 0, 1, 2, 3,...at 5″. The middle panels display velocity fields (isovelocity contours are spaced at intervals of 20 km s−1), while the right panels present Moment 2 maps. The Gaussian beam is shown on the bottom left of each map.
atoms cm−2, n = 0, 1, 2, 3,...at 5″. The middle panels display velocity fields (isovelocity contours are spaced at intervals of 20 km s−1), while the right panels present Moment 2 maps. The Gaussian beam is shown on the bottom left of each map.
Current usage metrics show cumulative count of Article Views (full-text article views including HTML views, PDF and ePub downloads, according to the available data) and Abstracts Views on Vision4Press platform.
Data correspond to usage on the plateform after 2015. The current usage metrics is available 48-96 hours after online publication and is updated daily on week days.
Initial download of the metrics may take a while.