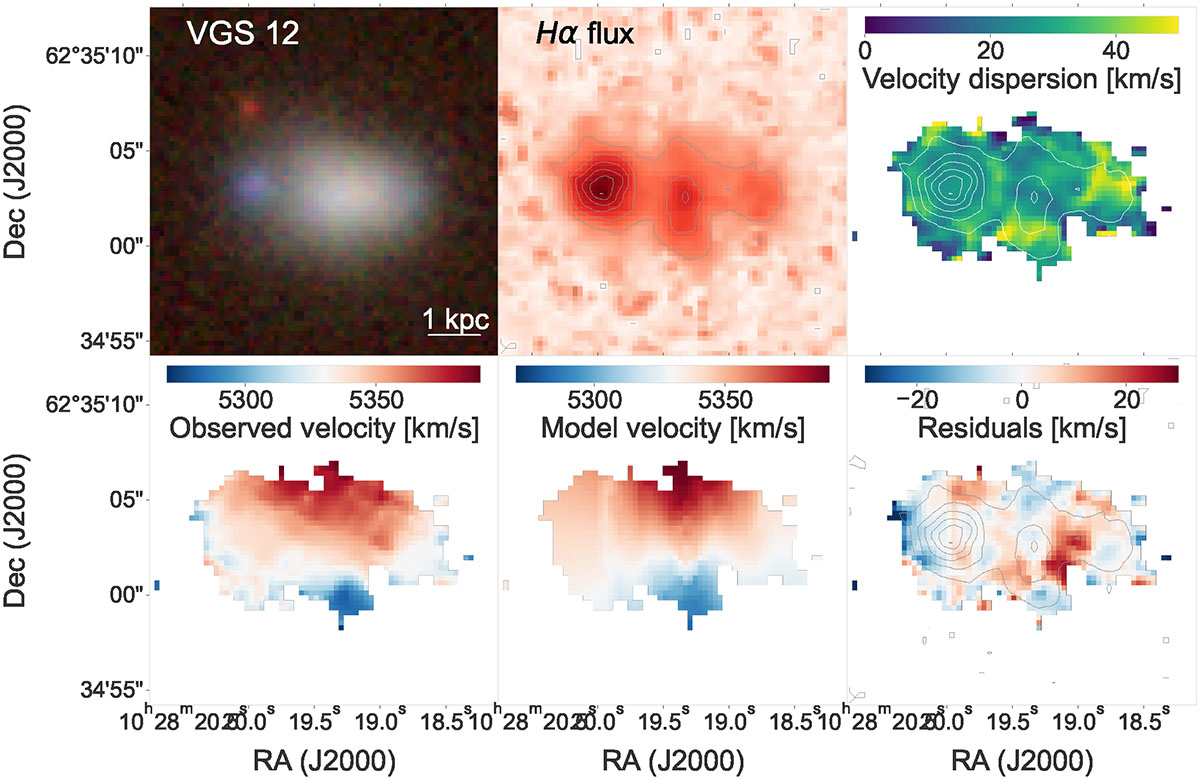
Fig. 3.
Download original image
Top row: colored Legacy Survey grz-image (left-hand panel); map of Hα fluxes (middle panel); map of the ionized-gas velocity dispersions (right-hand panel). Bottom row: observed ionized-gas velocity field (left-hand panel); velocity field obtained with a tilted-ring model (middle panel); map of residuals after subtracting the model velocity field from the observed one (right-hand panel). The Hα contours are overlaid on the top middle, top right, and bottom right panels.
Current usage metrics show cumulative count of Article Views (full-text article views including HTML views, PDF and ePub downloads, according to the available data) and Abstracts Views on Vision4Press platform.
Data correspond to usage on the plateform after 2015. The current usage metrics is available 48-96 hours after online publication and is updated daily on week days.
Initial download of the metrics may take a while.